

XRP Price Turns Red as Bulls Step Back and Bears Test Market Strength

XRP price started a fresh decline from $2.550. The price is now showing bearish signs and might extend losses if it dips below $2.250.
- XRP price started a fresh decline below the $2.450 zone.
- The price is now trading below $2.40 and the 100-hourly Simple Moving Average.
- There is a short-term contracting triangle forming with resistance at $2.235 on the hourly chart of the XRP/USD pair (data source from Kraken).
- The pair could continue to move down if it settles below $2.250.
XRP Price Dips Further
XRP price attempted more gains above $2.50 but failed to continue higher, like Bitcoin and Ethereum. The price started a fresh decline below $2.450 and $2.420.
There was a move below the $2.320 pivot level. A low was formed at $2.2754, and the price is now consolidating losses with a bearish angle below the 23.6% Fib retracement level of the recent decline from the $2.525 swing high to the $2.2754 low.
The price is now trading below $2.40 and the 100-hourly Simple Moving Average. If there is a fresh upward move, the price might face resistance near the $2.2350 level. There is also a short-term contracting triangle forming with resistance at $2.235 on the hourly chart of the XRP/USD pair.
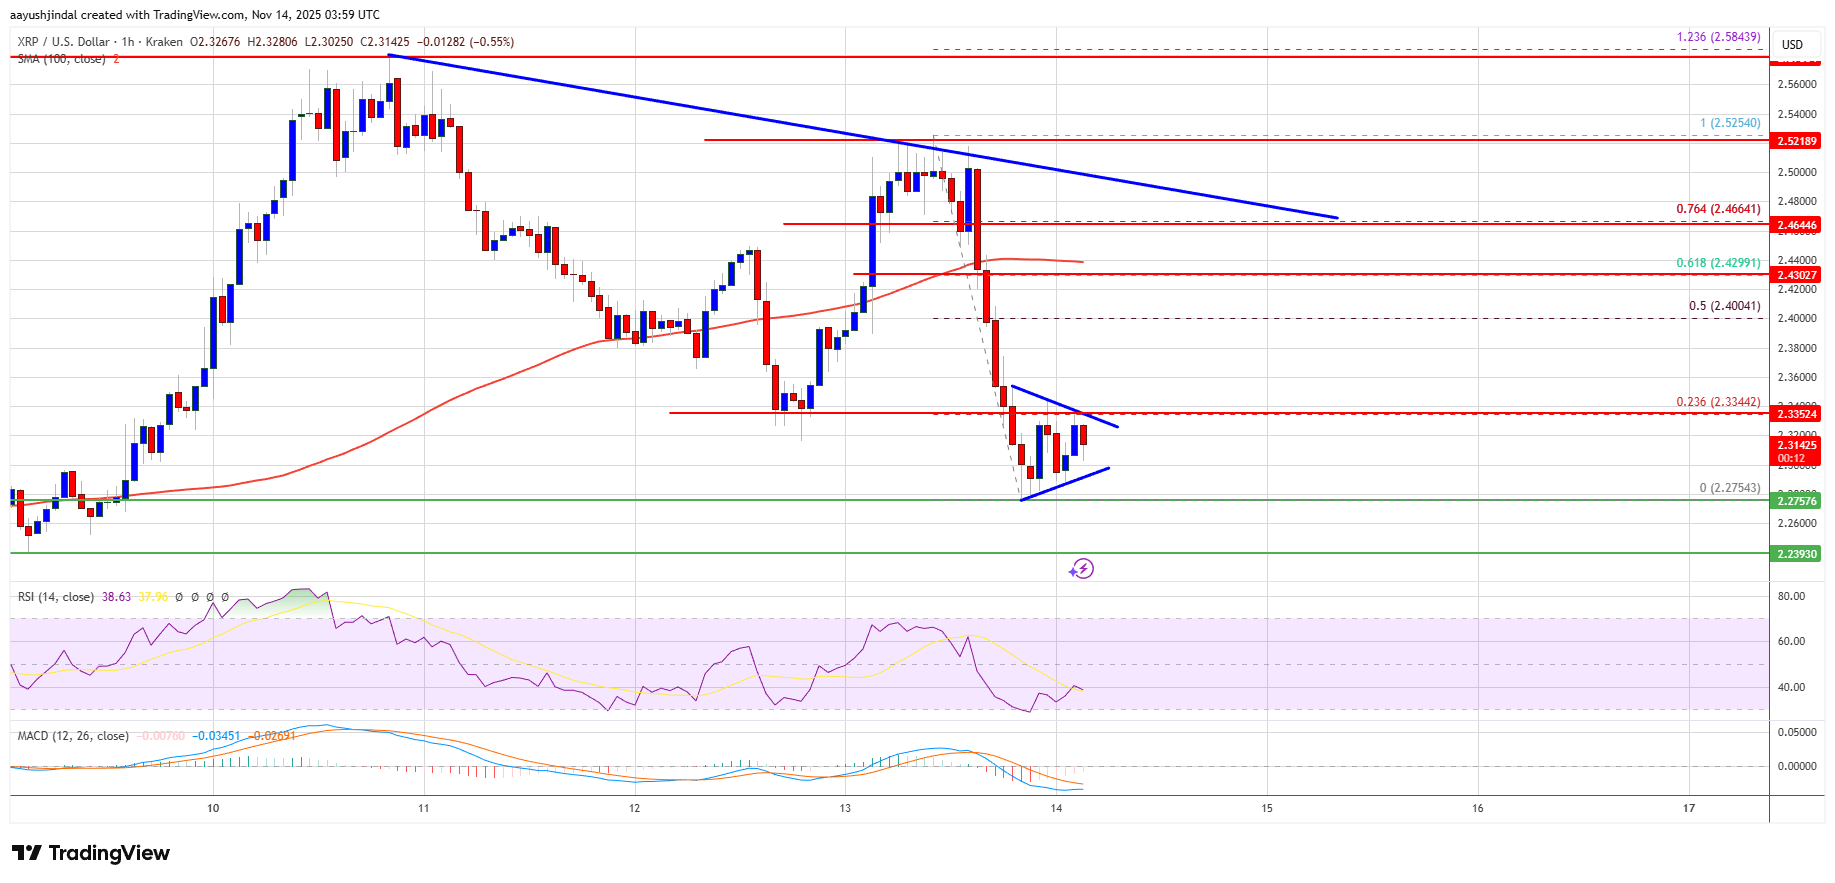
The first major resistance is near the $2.40 level, above which the price could rise and test $2.450 or the 76.4% Fib retracement level of the recent decline from the $2.525 swing high to the $2.2754 low. A clear move above the $2.450 resistance might send the price toward the $2.520 resistance. Any more gains might send the price toward the $2.580 resistance. The next major hurdle for the bulls might be near $2.650.
Another Decline?
If XRP fails to clear the $2.40 resistance zone, it could start a fresh decline. Initial support on the downside is near the $2.280 level. The next major support is near the $2.250 level.
If there is a downside break and a close below the $2.250 level, the price might continue to decline toward $2.20. The next major support sits near the $2.120 zone, below which the price could continue lower toward $2.050.
Technical Indicators
Hourly MACD – The MACD for XRP/USD is now gaining pace in the bearish zone.
Hourly RSI (Relative Strength Index) – The RSI for XRP/USD is now below the 50 level.
Major Support Levels – $2.250 and $2.20.
Major Resistance Levels – $2.40 and $2.450.

Related Articles

Relay adds TRON support, delivering seamless USDT swaps via multichain API and flagship app
Relay now supports TRON USDT swaps, enabling instant USDT transfers via its...

Relay adds TRON support, delivering seamless USDT swaps via multichain API and flagship app
Relay now supports TRON USDT swaps, enabling instant USDT transfers via its...

BitMine appoints new CEO amid Ether buying spree
BitMine held about $11 billion worth of ETH as of this week,...

BitMine appoints new CEO amid Ether buying spree
BitMine held about $11 billion worth of ETH as of this week,...
Leave a comment