-
×
 Fashion cap
1 × $9.00
Fashion cap
1 × $9.00
Subtotal: $9.00
 Fashion cap
1 × $9.00
Fashion cap
1 × $9.00 Subtotal: $9.00
Fashion cap
1 × $9.00 Subtotal: $9.00

XRP price started a fresh increase above $2.450. The price is now showing positive signs but faces a major hurdle near the $2.620 level.
XRP price found support and started a strong recovery wave above $2.20, like Bitcoin and Ethereum. The price was able to climb above the $2.250 and $2.320 levels to enter a positive zone.
There was a decent increase above the 61.8% Fib retracement level of the downward move from the $3.05 swing high to the $1.40 swing low. However, the price seems to be facing a major barrier near the $2.650 level. Besides, there is a key bearish trend line forming with resistance at $2.650 on the hourly chart of the XRP/USD pair.
The price is now trading above $2.520 and the 100-hourly Simple Moving Average. If there is a fresh upward move, the price might face resistance near the $2.60 level.
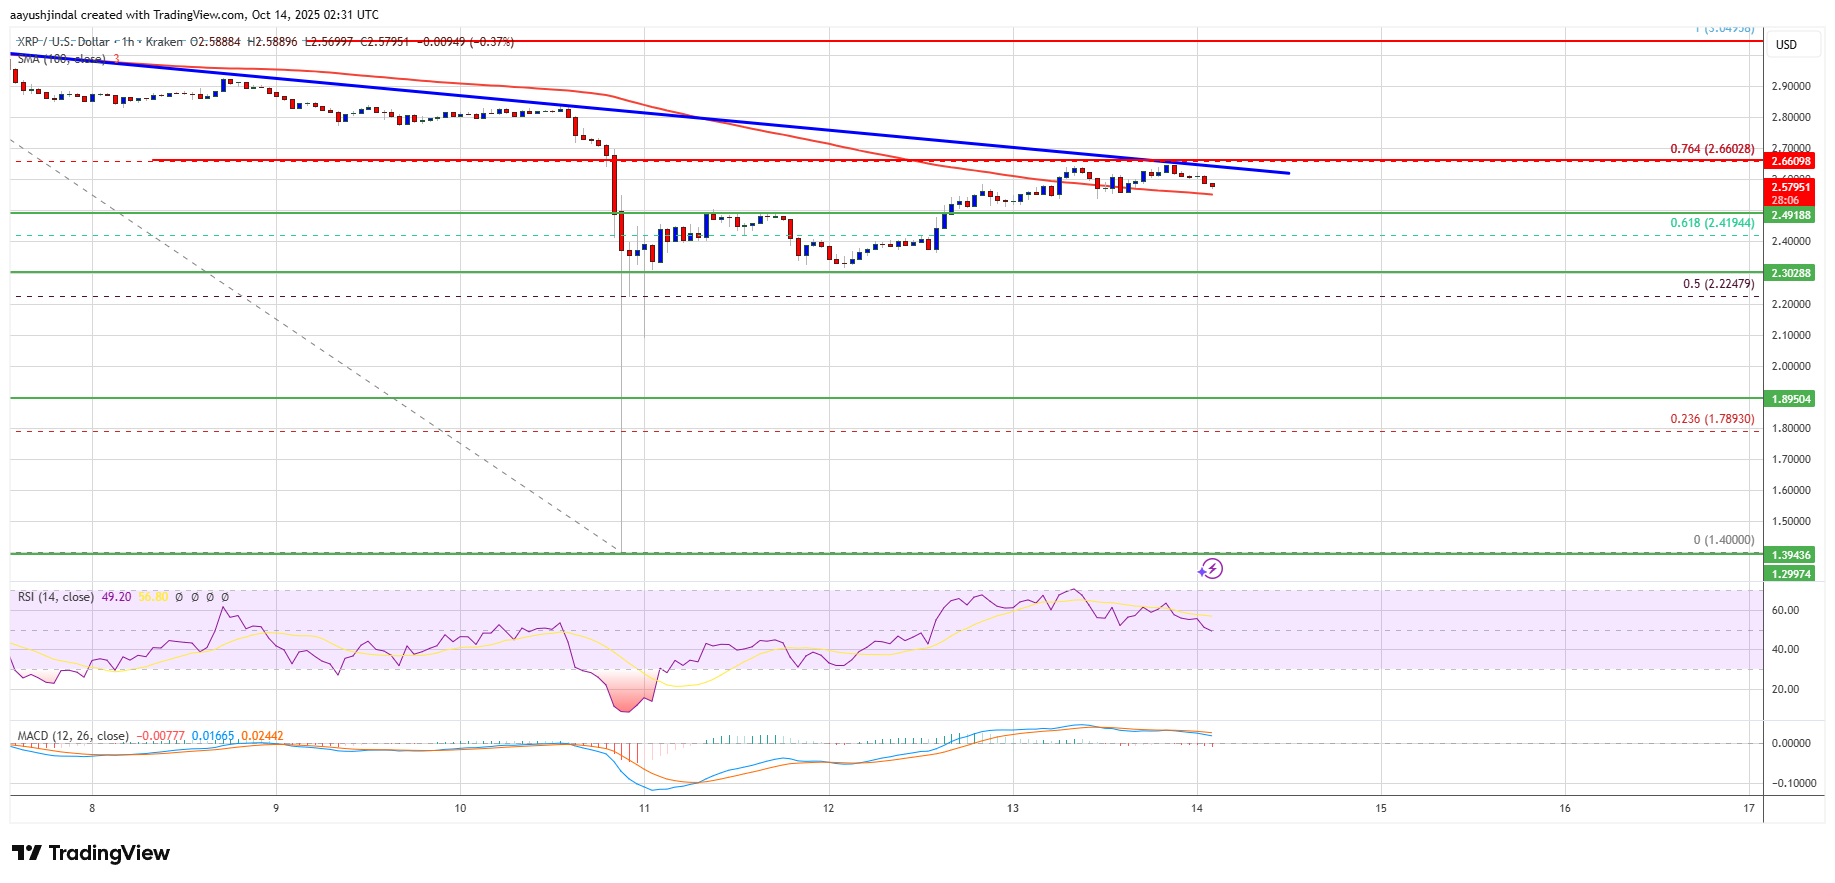
The first major resistance is near the $2.650 level and the trend line. It is close to the 76.4% Fib retracement level of the downward move from the $3.05 swing high to the $1.40 swing low. A clear move above the $2.650 resistance might send the price toward the $2.70 resistance. Any more gains might send the price toward the $2.720 resistance. The next major hurdle for the bulls might be near $2.80.
If XRP fails to clear the $2.650 resistance zone, it could start a fresh decline. Initial support on the downside is near the $2.550 level. The next major support is near the $2.50 level.
If there is a downside break and a close below the $2.50 level, the price might continue to decline toward $2.30. The next major support sits near the $2.2680 zone, below which the price could continue lower toward $2.220.
Technical Indicators
Hourly MACD – The MACD for XRP/USD is now losing pace in the bullish zone.
Hourly RSI (Relative Strength Index) – The RSI for XRP/USD is now near the 50 level.
Major Support Levels – $2.50 and $2.30.
Major Resistance Levels – $2.60 and $2.650.
Despite Bitcoin price drop, BTC held on exchanges has dropped to its...
House of Doge, the trading arm of the Dogecoin Foundation, has announced...
Following a steep correction, Solana price has bounced back above a key...
Bitcoin and Ethereum spot ETFs recorded a combined $755 million in net...


Leave a comment