- Home
- Advertise With us
- World News
- Tech
- Entertainment
- Travels & Tours
- Contact US
- About us
- Privacy Policy
Top Insights
XRP MVRV Ratio Flashes Signal That Last Led To 630% Surge

An analyst has pointed out that the XRP Market Value to Realized Value (MVRV) Ratio has just formed a crossover that proved to be highly bullish the last time it appeared.
XRP MVRV Ratio Has Broken Above Its 200-Day MA
In a new post on X, analyst Ali Martinez has talked about a crossover that has recently occurred in the MVRV Ratio of XRP. The “MVRV Ratio” is a popular on-chain indicator that keeps track of the ratio between the asset’s Market Cap and Realized Cap.
The Realized Cap here refers to a capitalization model that calculates the cryptocurrency’s total value by assuming that the value of each coin in circulation is equal to the price at which it was last transacted on the blockchain. This is unlike the Market Cap, which simply takes the current spot price as the same one value for all coins.
The last transfer of any token is likely to represent the last time it changed hands, so the price at its time can be denoted as its current cost basis. As such, the Realized Cap represents the sum of the cost basis of the entire circulating supply.
One way to interpret the model is as a measure of the amount of capital that the investors as a whole have stored in the cryptocurrency. The Market Cap, on the other hand, signifies the value that the holders are carrying in the present.
When the value of the MVRV Ratio is more than 1, it means the Market Cap is greater than the Realized Cap. In other words, the investors are holding more than they put in. On the other hand, the metric being under this threshold suggests the overall network is underwater.
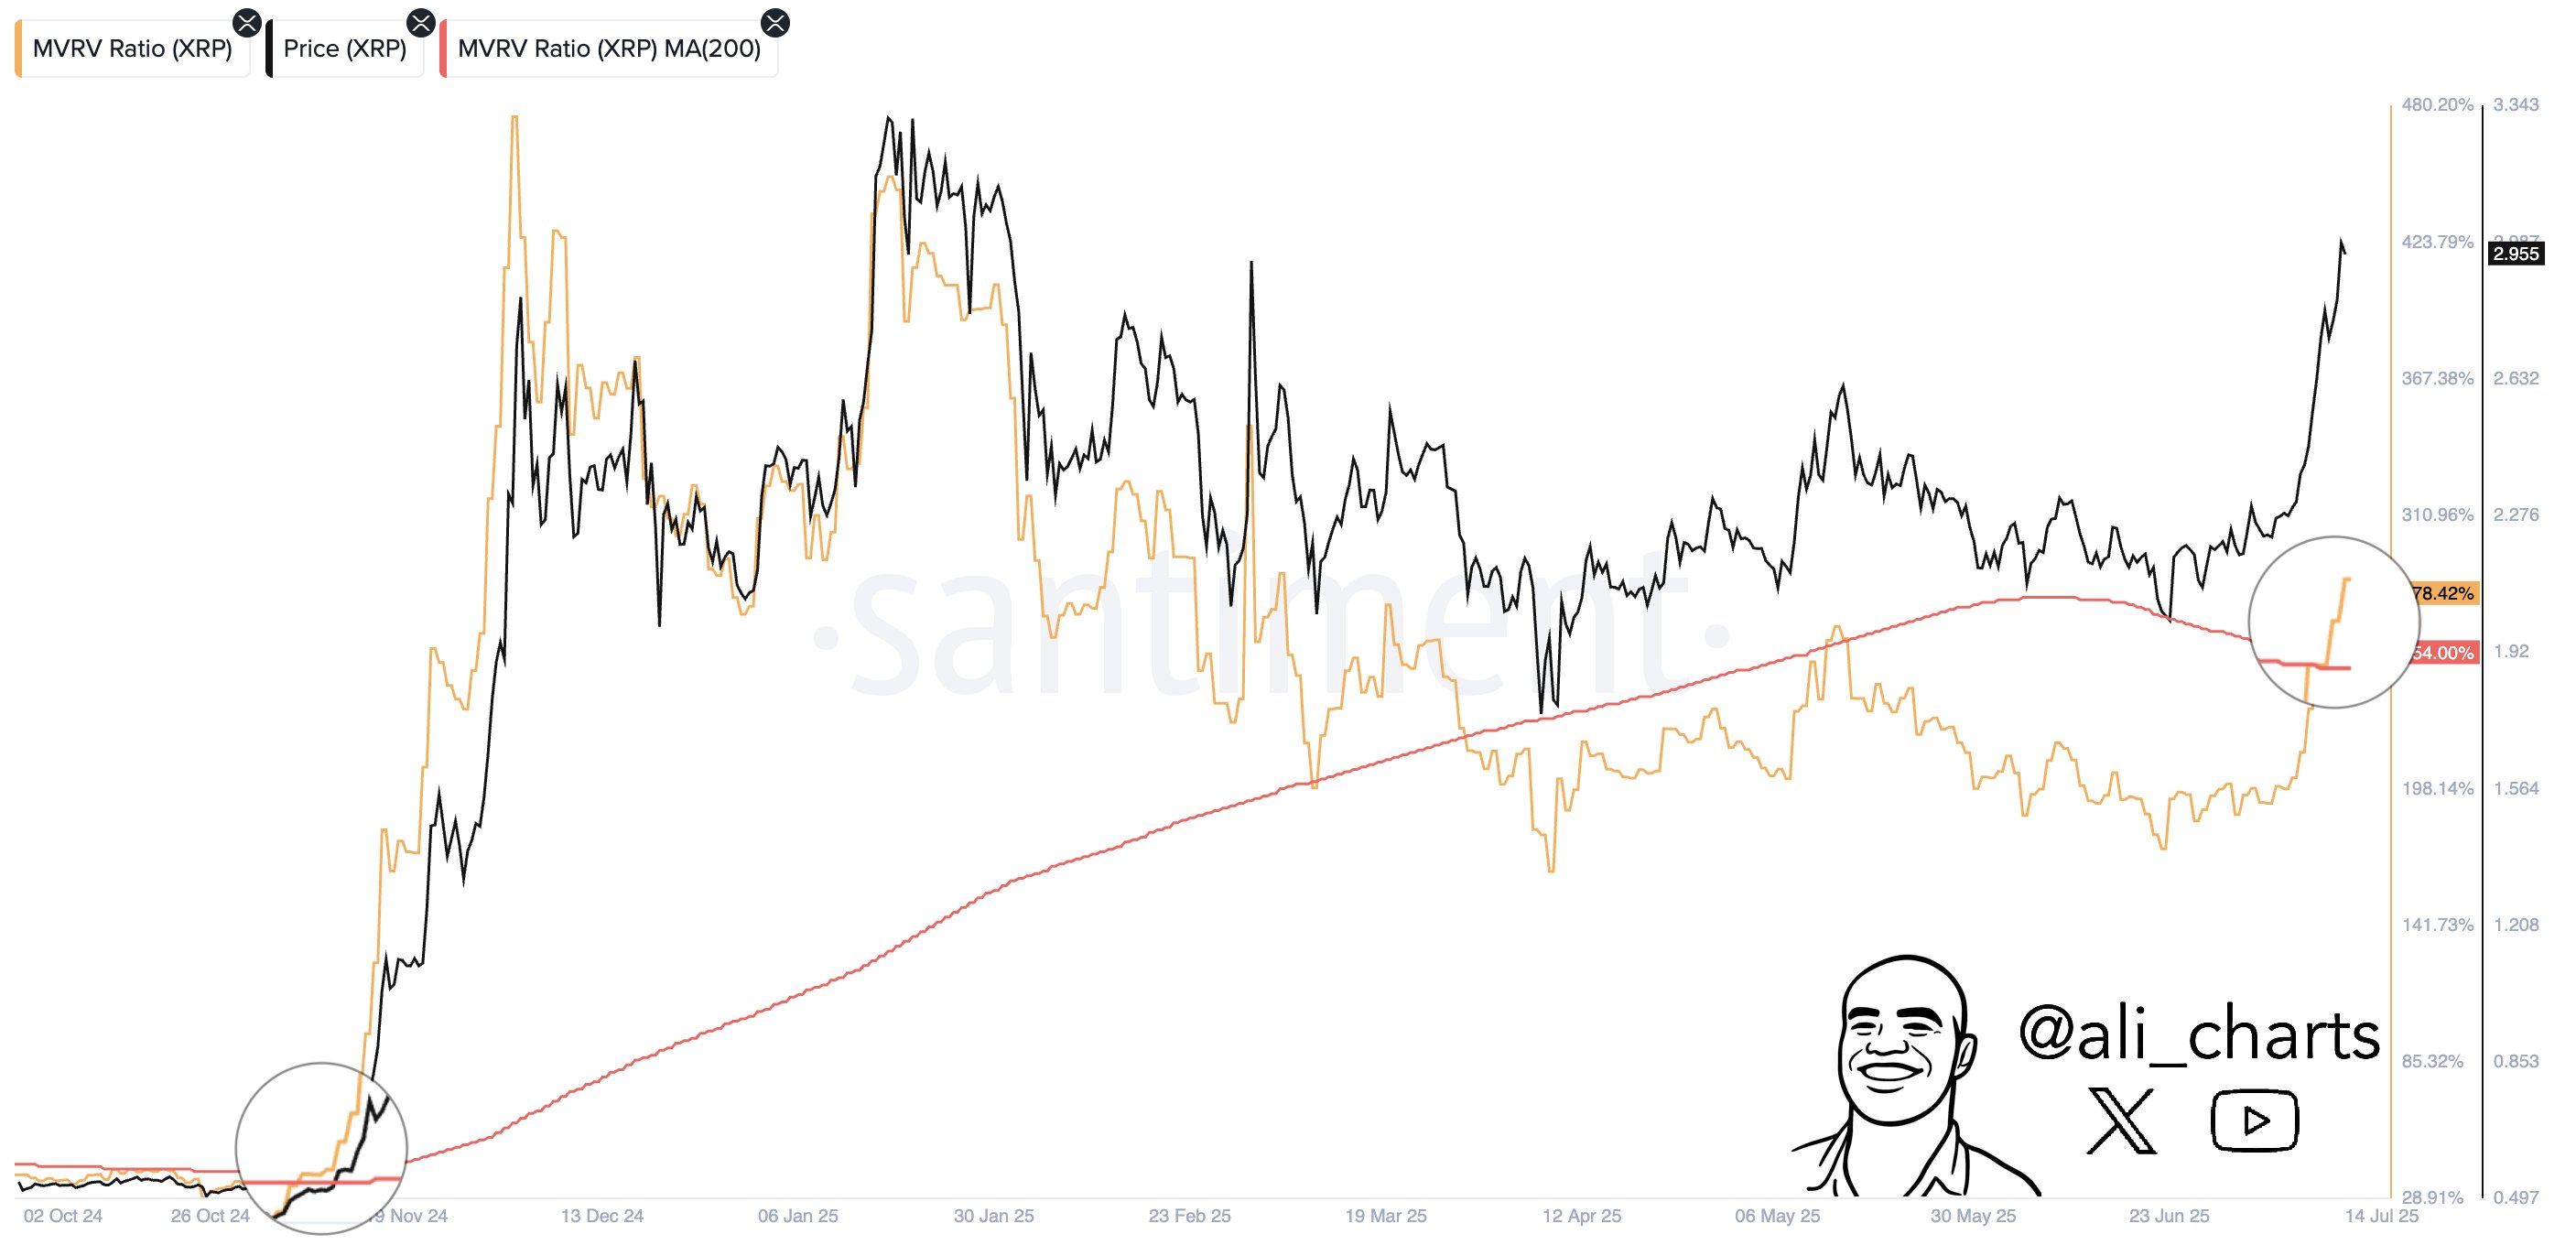
Now, here is the chart shared by Martinez that shows the trend in the XRP MVRV Ratio, as well as its 200-day moving average (MA), over the past year:
As displayed in the above graph, the XRP MVRV Ratio has seen a sharp surge recently as the asset’s breakout has occurred. With this uptrend, the indicator has managed to break past its 200-day MA.
In the chart, the analyst has highlighted the last time that the cryptocurrency’s MVRV Ratio and its 200-day MA showed this type of crossover. What followed back then was a significant bull run in which the coin managed to rise by around 630%.
Given this precedence, it now remains to be seen whether the latest crossover will also prove to be a golden one for XRP.
XRP Price
At the time of writing, XRP is floating around $3.32, up 33% in the last seven days.
Related Articles
KuCoin Launches xStocks, Delivering a One-Stop Access Point to Top Global Tokenized Equities
[PRESS RELEASE – VICTORIA, Seychelles, July 18th, 2025] On July 18, 2025,...
XRP jumps 22% into price discovery as market cap hits a record $210B
XRP’s rally to $3.66 all-time high came amid the passage of major...
DeFi backbone of ASI Alliance Singularity Finance unveils H2 2025 roadmap
Singularity Finance, the ASI Alliance’s financial arm, has released its H2 2025...
Dogecoin Erupts Past $0.23—Analyst Predicts Next Price Targets
The latest burst of momentum has carried the Dogecoin price through the...


Leave a comment