
Solana (SOL) Trades Heavy Below $90 As Breakdown Risk Grows
Solana failed to stay above $90 and corrected gains. SOL price is now trading below $85 and might find bids near the $76 zone.
- SOL price started a downside correction below $85 against the US Dollar.
- The price is now trading below $82 and the 100-hourly simple moving average.
- There is a bearish trend line forming with resistance at $81 on the hourly chart of the SOL/USD pair (data source from Kraken).
- The pair could extend losses if it dips below the $76 zone.
Solana Price Starts Downside Correction
Solana price failed to surpass $90 and started a downside correction, like Bitcoin and Ethereum. SOL dipped below $85 and $82 to enter a short-term bearish zone.
There was a move below the 50% Fib retracement level of the upward wave from the $67.40 swing low to the $89.72 high. Besides, there is a bearish trend line forming with resistance at $81 on the hourly chart of the SOL/USD pair.
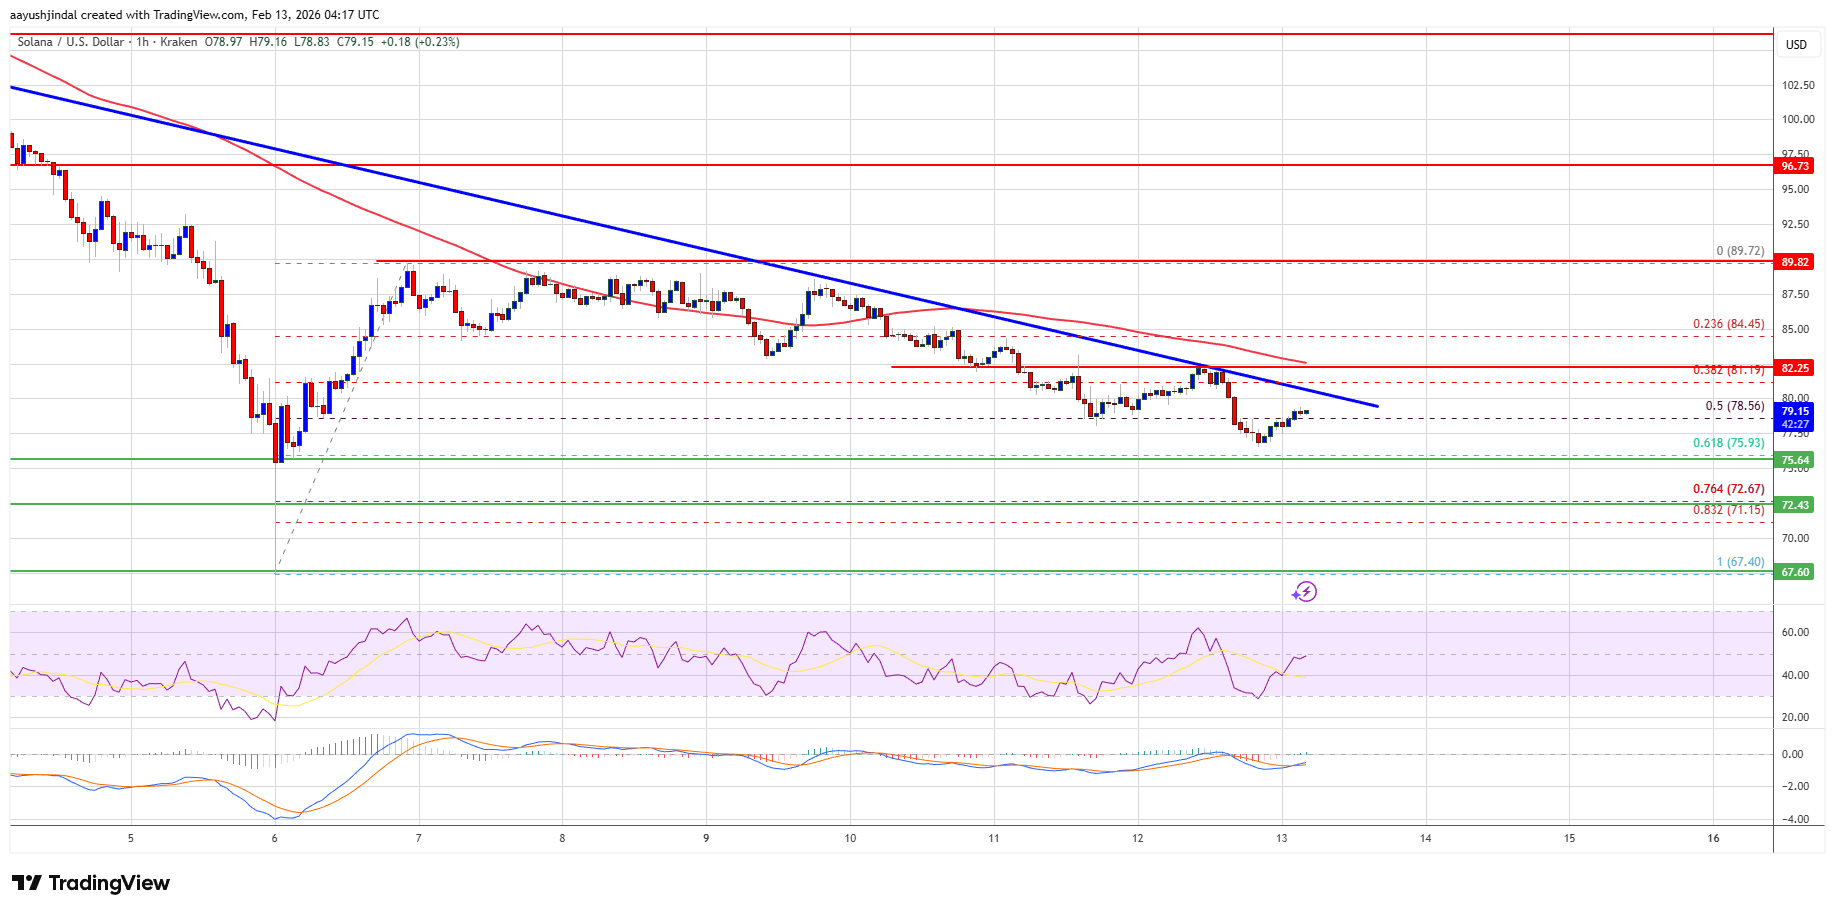
Solana is now trading below $80 and the 100-hourly simple moving average. On the upside, the price is facing resistance near the $81 level and the trend line. The next major resistance is near the $82.20 level. The main resistance could be $85. A successful close above the $85 resistance zone could set the pace for another steady increase. The next key resistance is $90. Any more gains might send the price toward the $102 level.
More Losses In SOL?
If SOL fails to rise above the $82 resistance, it could start another decline. Initial support on the downside is near the $76 zone and the 61.8% Fib retracement level of the upward wave from the $67.40 swing low to the $89.72 high. The first major support is near the $72.50 level.
A break below the $72.50 level might send the price toward the $68 support zone. If there is a close below the $68 support, the price could decline toward the $60 support in the near term.
Technical Indicators
Hourly MACD – The MACD for SOL/USD is gaining pace in the bearish zone.
Hourly Hours RSI (Relative Strength Index) – The RSI for SOL/USD is below the 50 level.
Major Support Levels – $76 and $72.50.
Major Resistance Levels – $81 and $85.

Related Articles

XRP price prediction ahead of January US CPI report today
XRP price is hovering near $1.35 as markets closely watch the January...

ETHZilla offers token tied to jet engine leases amid tokenization pivot
Crypto treasury firm ETHZilla recently sold some of its crypto to begin...

How might Bitcoin price react as $2.5B in BTC options expire today (Feb. 13)?
Bitcoin price trades near $68,000 as $2.5 billion in BTC options expire...

SEC chair warns some prediction markets may fall under securities laws
The head of the U.S. Securities and Exchange Commission says prediction markets...
Leave a comment