


Solana (SOL) Stays Strong – Can Bulls Fuel the Next Breakout?

Solana started a fresh increase above the $215 zone. SOL price is now consolidating above $212 and might aim for more gains above the $220 zone.
- SOL price started a fresh upward move above the $205 and $212 levels against the US Dollar.
- The price is now trading above $212 and the 100-hourly simple moving average.
- There is a bullish trend line forming with support at $216 on the hourly chart of the SOL/USD pair (data source from Kraken).
- The pair could extend gains if it clears the $220 resistance zone.
Solana Price Eyes Upside Break
Solana price started a decent increase after it found support near the $202 zone, beating Bitcoin and Ethereum. SOL climbed above the $208 level to enter a short-term positive zone.
The price even smashed the $215 resistance. The bulls were able to push the price above the $218 barrier. A high was formed at $220 and the price is consolidating gains above the 23.6% Fib retracement level of the upward move from the $199 swing low to the $220 high.
Solana is now trading above $212 and the 100-hourly simple moving average. There is also a bullish trend line forming with support at $216 on the hourly chart of the SOL/USD pair.
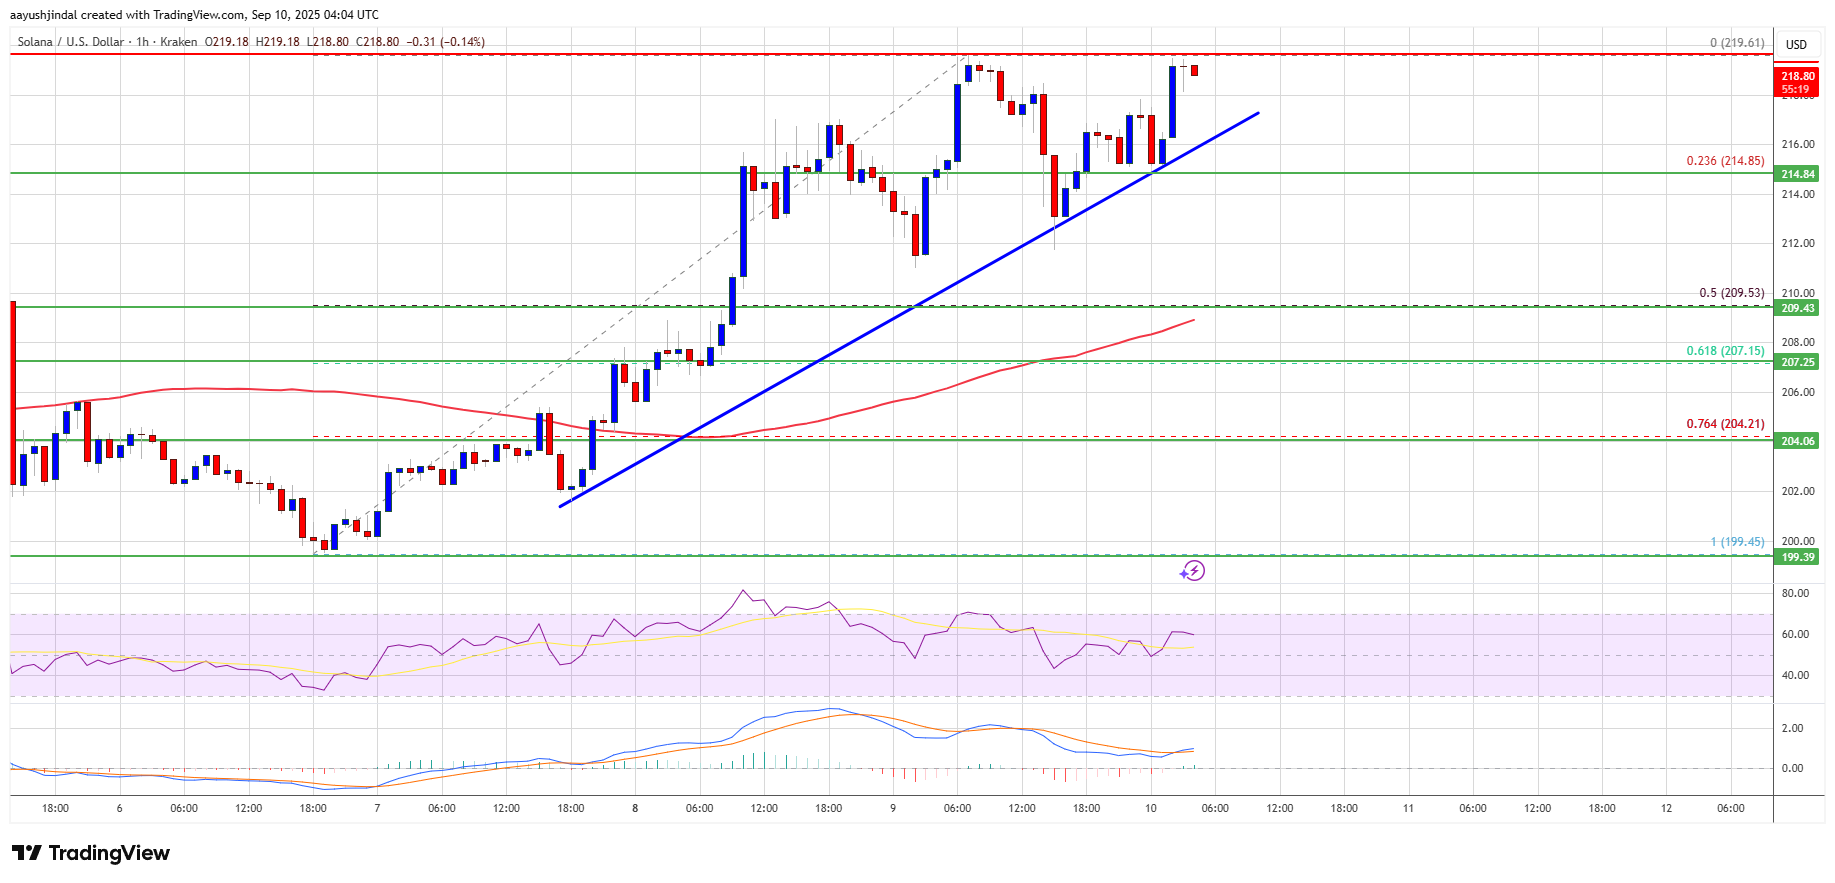
On the upside, the price is facing resistance near the $220 level. The next major resistance is near the $228 level. The main resistance could be $232. A successful close above the $232 resistance zone could set the pace for another steady increase. The next key resistance is $244. Any more gains might send the price toward the $250 level.
Downside Correction In SOL?
If SOL fails to rise above the $220 resistance, it could start another decline. Initial support on the downside is near the $216 zone and the trend line. The first major support is near the $210 level or the 50% Fib retracement level of the upward move from the $199 swing low to the $220 high.
A break below the $210 level might send the price toward the $202 support zone. If there is a close below the $202 support, the price could decline toward the $195 support in the near term.
Technical Indicators
Hourly MACD – The MACD for SOL/USD is gaining pace in the bullish zone.
Hourly Hours RSI (Relative Strength Index) – The RSI for SOL/USD is above the 50 level.
Major Support Levels – $216 and $210.
Major Resistance Levels – $220 and $232.


Related Articles

Binance and Franklin Templeton join forces on tokenization ventures
Binance has partnered with the crypto ETF issuer Franklin Templeton to explore...

Dogecoin ETF pushes crypto industry to embrace speculation
The first US Dogecoin ETF sparks debate over whether it’s a milestone...

Falcon Finance Announced $FF and Community Sale on Buidlpad
[PRESS RELEASE – Dubai, UAE, September 10th, 2025, Chainwire] Falcon Finance is...

Crypto’s crosschain future depends on regulatory readiness
Regulatory compliance is reshaping crosschain crypto as AML blind spots persist in...
Leave a comment