


Solana (SOL) Recovery Shows Strength After Breaking Initial Resistance Level
Solana failed to settle above $85 and trimmed some gains. SOL price is now recovering losses from $76 and showing a few positive signs.
- SOL price started a decent recovery wave above $78 and $80 against the US Dollar.
- The price is now trading above $80 and the 100-hourly simple moving average.
- There was a break above a key bearish trend line with resistance at $81 on the hourly chart of the SOL/USD pair (data source from Kraken).
- The price could continue to move up if it clears $82 and $84.
Solana Price Attempts Recovery
Solana price remained stable and started a decent recovery wave above $78, like Bitcoin and Ethereum. SOL was able to climb above the $80 level.
There was a move above the 50% Fib retracement level of the downward move from the $86.68 swing high to the $75.64 low. Besides, there was a break above a key bearish trend line with resistance at $81 on the hourly chart of the SOL/USD pair.
However, the bears are active near $82.50 and the 61.8% Fib retracement level of the downward move from the $86.68 swing high to the $75.64 low. Solana is now trading above $80 and the 100-hourly simple moving average.
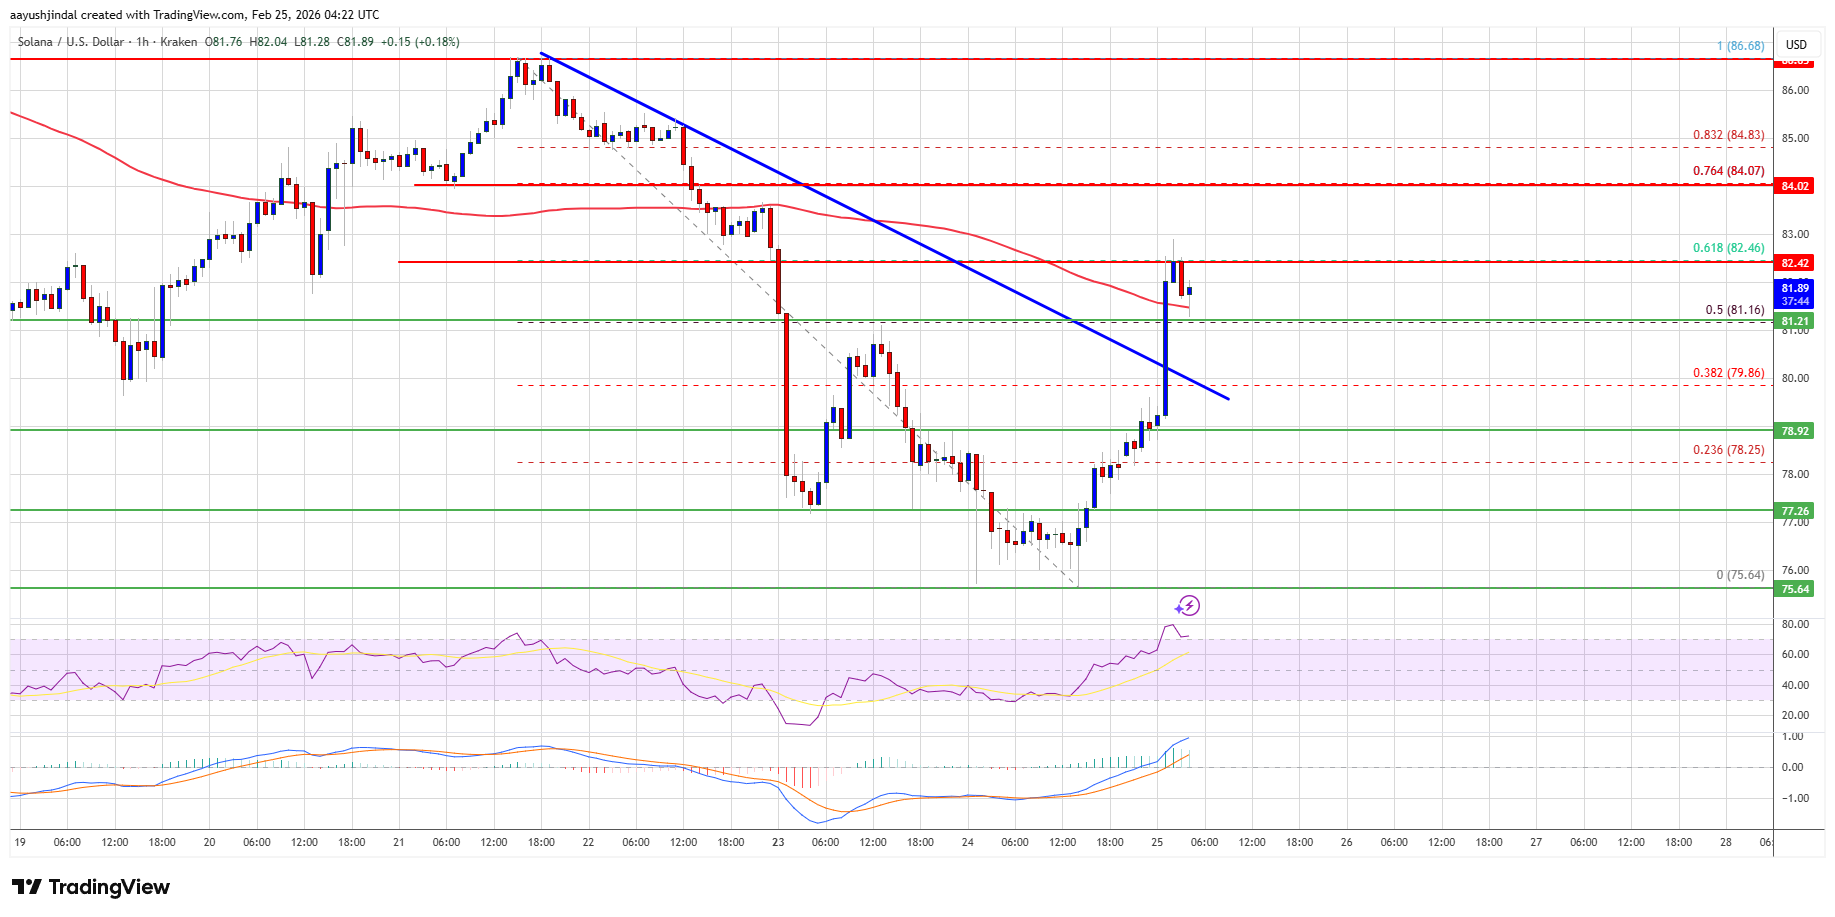
On the upside, immediate resistance is near the $82 level. The next major resistance is near the $84 level. The main resistance could be $85. A successful close above the $85 resistance zone could set the pace for another steady increase. The next key resistance is $92. Any more gains might send the price toward the $95 level.
Another Decline In SOL?
If SOL fails to rise above the $82 resistance, it could continue to move down. Initial support on the downside is near the $80 zone. The first major support is near the $79 level.
A break below the $79 level might send the price toward the $77 support zone. If there is a close below the $77 support, the price could decline toward the $74 zone in the near term.
Technical Indicators
Hourly MACD – The MACD for SOL/USD is gaining pace in the bullish zone.
Hourly Hours RSI (Relative Strength Index) – The RSI for SOL/USD is above the 50 level.
Major Support Levels – $80 and $77.
Major Resistance Levels – $82 and $85.


Related Articles
U.S. senator launches inquiry into Binance’s alleged sanctions violations
U.S. Senator Richard Blumenthal announced a formal Senate inquiry into Binance after...
Most Crypto Assets Need To Go To Zero, Research Firm Says
Castle Labs is arguing that crypto’s long tail is structurally overbuilt and...

Sam Bankman-Fried’s social media campaign fails to sway Trump on pardon
The White House has reaffirmed that former FTX CEO Sam Bankman-Fried will...
Bitcoin adoption is booming, even if its price isn’t: River
River reports that Bitcoin adoption surged in 2025, cementing it as a...
Leave a comment