


Solana (SOL) Positions for Breakout as Market Sentiment Turns Bullish

Solana failed to stay above $90 and corrected some gains. SOL price is now below $88 and might aim for another increase above $90.
- SOL price started a downside correction below $88 against the US Dollar.
- The price is now trading above $85 and the 100-hourly simple moving average.
- There is a bullish trend line forming with support at $85 on the hourly chart of the SOL/USD pair (data source from Kraken).
- The pair could extend losses if it dips below the $84 zone.
Solana Price Remains Supported
Solana price failed to stay above $90 and started a downside correction, like Bitcoin and Ethereum. SOL dipped below $88 and $87 to enter a short-term bearish zone.
There was a move below the 50% Fib retracement level of the upward wave from the $81.71 swing low to the $90.29 high. The price even tested the $85 support. Besides, there is a bullish trend line forming with support at $85 on the hourly chart of the SOL/USD pair.
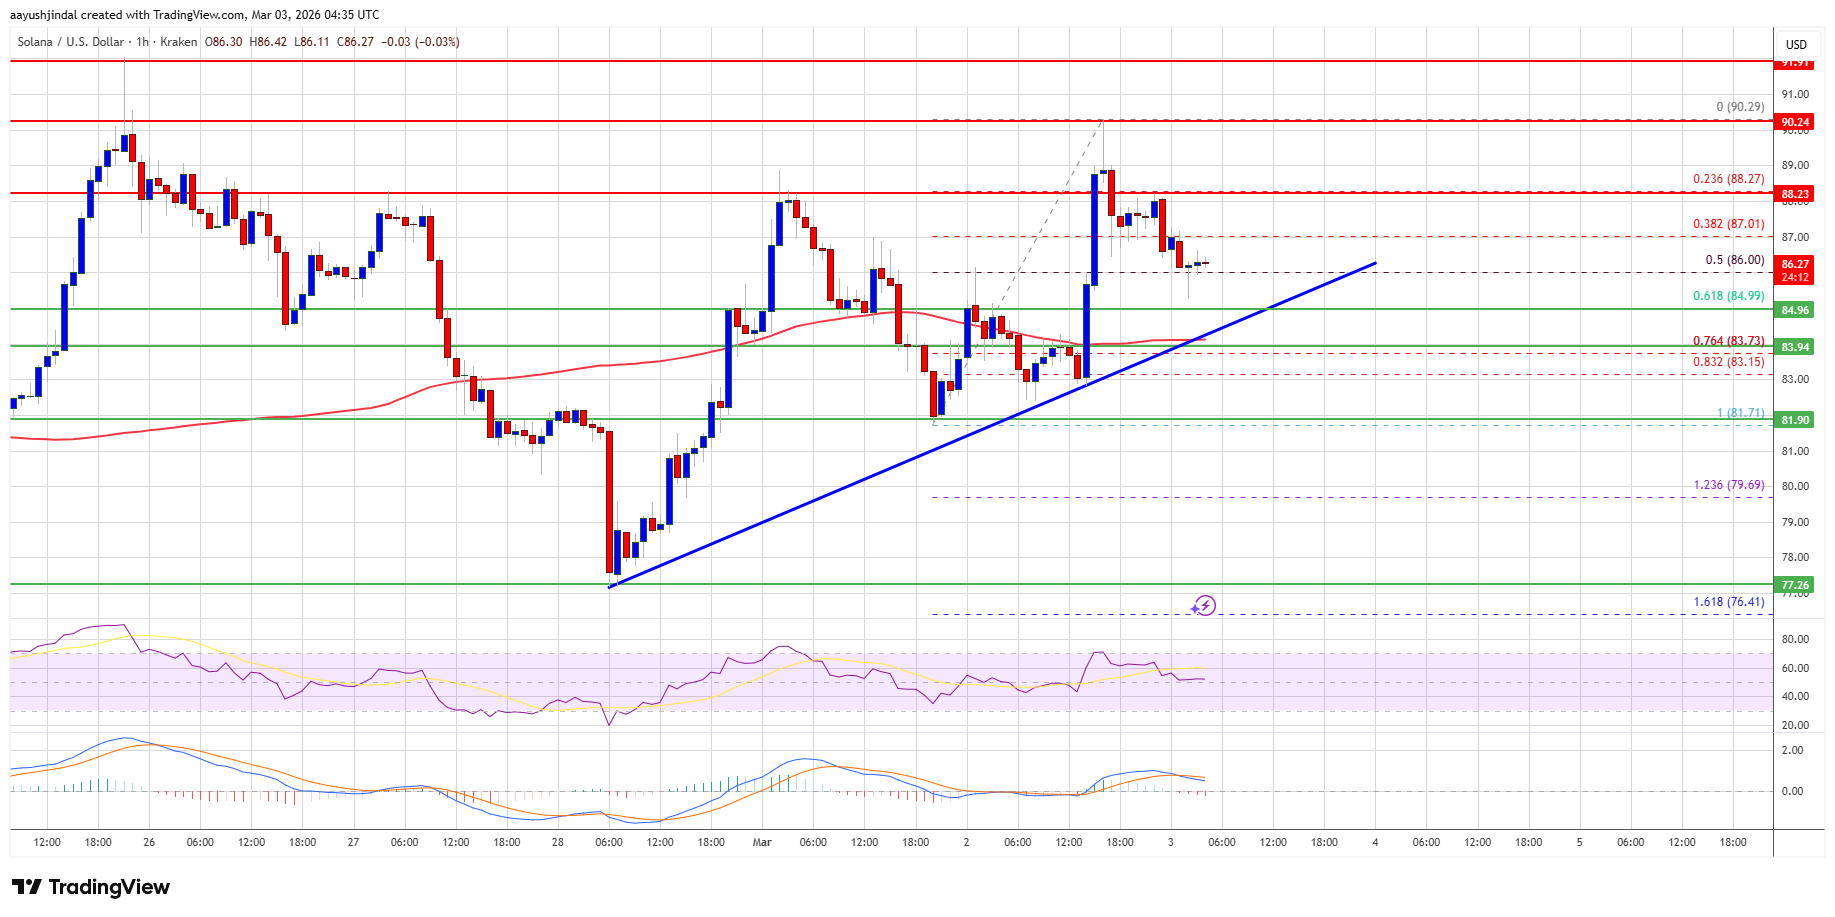
Solana is now trading above $85 and the 100-hourly simple moving average. On the upside, the price is facing resistance near the $88 level. The next major resistance is near the $90 level. The main resistance could be $92. A successful close above the $92 resistance zone could set the pace for another steady increase. The next key resistance is $96. Any more gains might send the price toward the $100 level.
More Losses In SOL?
If SOL fails to rise above the $90 resistance, it could start another decline. Initial support on the downside is near the $85 zone, the trend line, and the 61.8% Fib retracement level of the upward wave from the $81.71 swing low to the $90.29 high. The first major support is near the $84 level.
A break below the $84 level might send the price toward the $82 support zone. If there is a close below the $82 support, the price could decline toward the $76.50 support in the near term.
Technical Indicators
Hourly MACD – The MACD for SOL/USD is losing pace in the bullish zone.
Hourly Hours RSI (Relative Strength Index) – The RSI for SOL/USD is near the 50 level.
Major Support Levels – $85 and $82.
Major Resistance Levels – $88 and $90.
Related Articles

AI models prefer Bitcoin over fiat as top store of value, research shows
A new study from the Bitcoin Policy Institute finds that leading artificial...

Korea halts trading as key indexes drop 10% on Middle East crisis
South Korea’s Kospi and Kosdaq tripped circuit breakers as the Middle East...

U.S. shifts $23,000 in seized Bitcoin as ‘Villanueva’ wallet empties
A wallet on the Bitcoin blockchain associated with U.S. government seizure funds...

Bitcoin LTH Selling Cools: Is Months-Long Distribution Finally Ending?
On-chain data shows Bitcoin long-term holders (LTHs) have seen their netflow rise...
Leave a comment