


Solana (SOL) Gears Up For Another Rally Attempt — Can Bulls Clear $92 Barrier?

Solana failed to stay above $90 and corrected gains. SOL price is still above $85 and might attempt another increase in the near term.
- SOL price started a downside correction below $90 against the US Dollar.
- The price is now trading above $85 and the 100-hourly simple moving average.
- There is a rising channel forming with resistance at $88 on the hourly chart of the SOL/USD pair (data source from Kraken).
- The pair could extend losses if it dips below the $85 zone.
Solana Price Starts Downside Correction
Solana price failed to surpass $92 and started a downside correction, like Bitcoin and Ethereum. SOL dipped below $90 and $88 to enter a short-term bearish zone.
There was a move below the 50% Fib retracement level of the upward wave from the $76.54 swing low to the $91.20 high. However, the bulls were active above the $82 support. The price is back above $85. There is also a rising channel forming with resistance at $88 on the hourly chart of the SOL/USD pair.
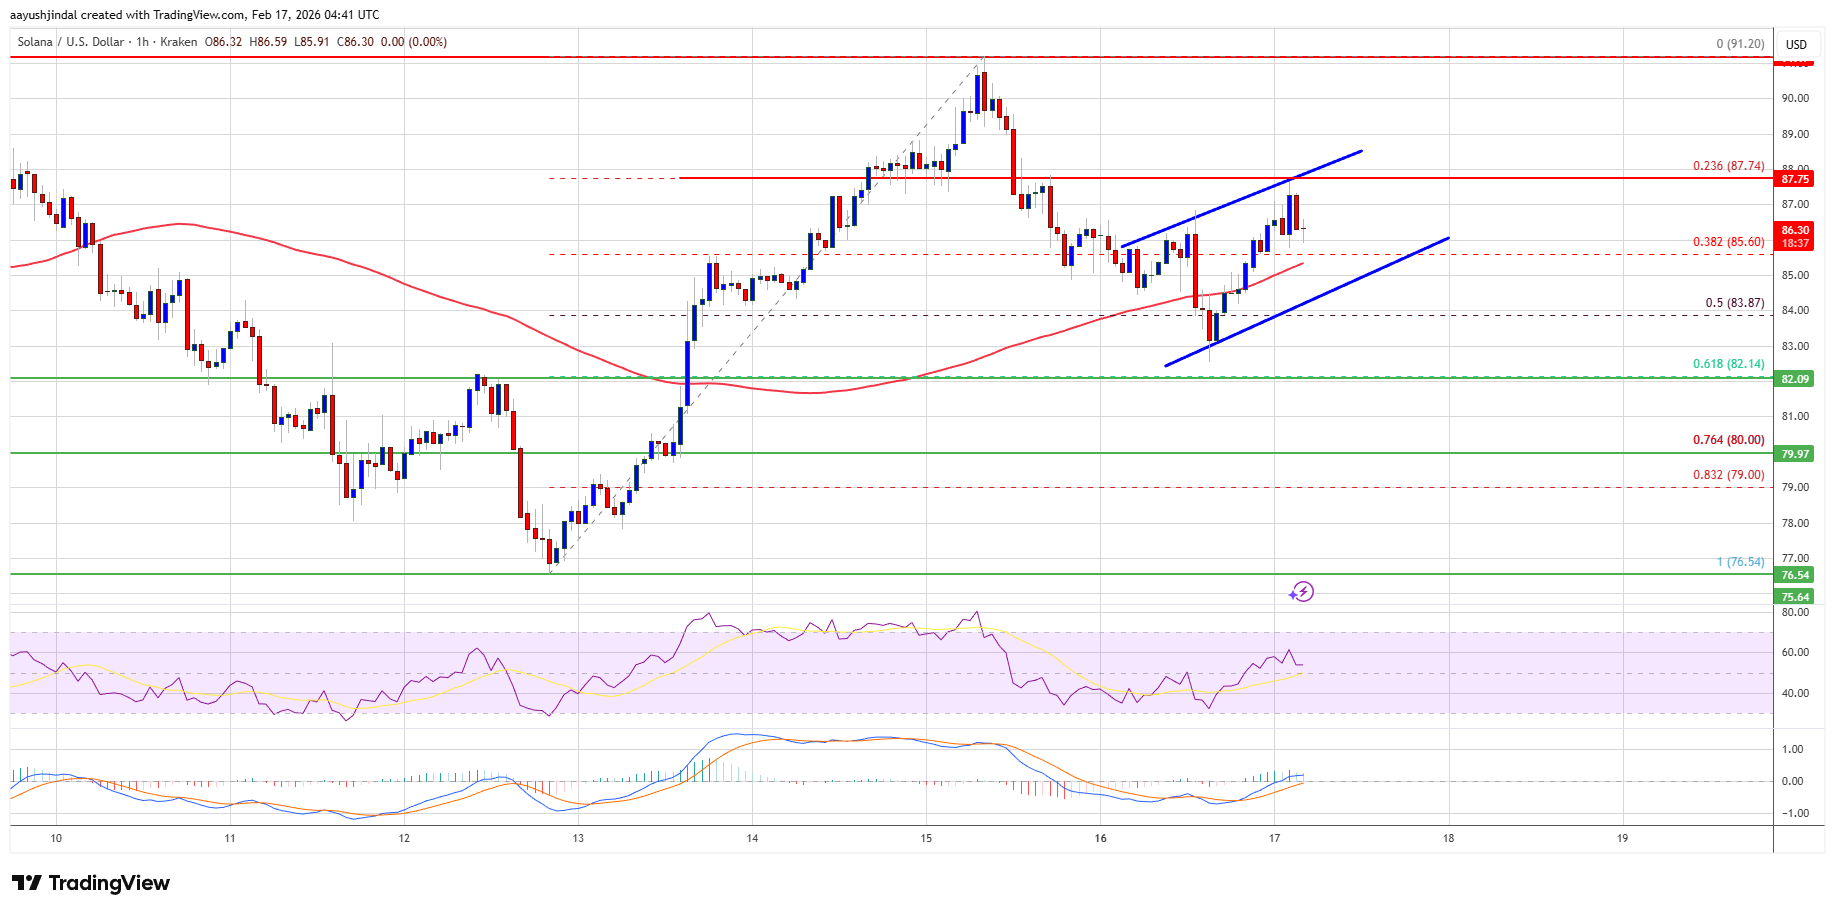
Solana is now trading above $85 and the 100-hourly simple moving average. On the upside, the price is facing resistance near the $88 level. The next major resistance is near the $90 level. The main resistance could be $92. A successful close above the $92 resistance zone could set the pace for another steady increase. The next key resistance is $95. Any more gains might send the price toward the $102 level.
Another Decline In SOL?
If SOL fails to rise above the $92 resistance, it could start another decline. Initial support on the downside is near the $85 zone. The first major support is near the $82 level or the 61.8% Fib retracement level of the upward wave from the $76.54 swing low to the $91.20 high.
A break below the $82 level might send the price toward the $76.50 support zone. If there is a close below the $76.50 support, the price could decline toward the $72 support in the near term.
Technical Indicators
Hourly MACD – The MACD for SOL/USD is gaining pace in the bullish zone.
Hourly Hours RSI (Relative Strength Index) – The RSI for SOL/USD is above the 50 level.
Major Support Levels – $85 and $82.
Major Resistance Levels – $88 and $92.

Related Articles

EU moves to cut off Russian crypto links amid domestic mining boom
The European Union is preparing a sweeping ban on cryptocurrency transactions involving...

German central bank chief sees merit in euro stablecoins, but CBDC remains in focus
German central bank president Joachim Nagel said he sees “merit in euro-denominated...
Dogecoin Sees Weekly Bearish Cross: Bottom Or Breakdown Next?
Dogecoin is flashing a rare weekly “bearish cross” just as traders debate...

Crypto extreme fear suggests incoming inflection point: Matrixport
With Bitcoin sentiment at four-year lows, analysts have flagged historic oversold signals...
Leave a comment