


Solana (SOL) At Risk of Fresh Bearish Wave, Traders Turn Cautious
Solana failed to stay above $126 and corrected gains. SOL price is now trading below $125 and might find bids near the $120 zone.
- SOL price started a downside correction below $125 against the US Dollar.
- The price is now trading above $125 and the 100-hourly simple moving average.
- There is a bearish trend line forming with resistance at $124 on the hourly chart of the SOL/USD pair (data source from Kraken).
- The pair could extend losses if it dips below the $120 zone.
Solana Price Starts Downside Correction
Solana price failed to surpass $130 and started a downside correction, like Bitcoin and Ethereum. SOL dipped below $126 and $125 to enter a short-term bearish zone.
There was a move below the 50% Fib retracement level of the upward wave from the $117 swing low to the $127 high. However, the bulls are active near $122. Besides, there is a bearish trend line forming with resistance at $124 on the hourly chart of the SOL/USD pair.
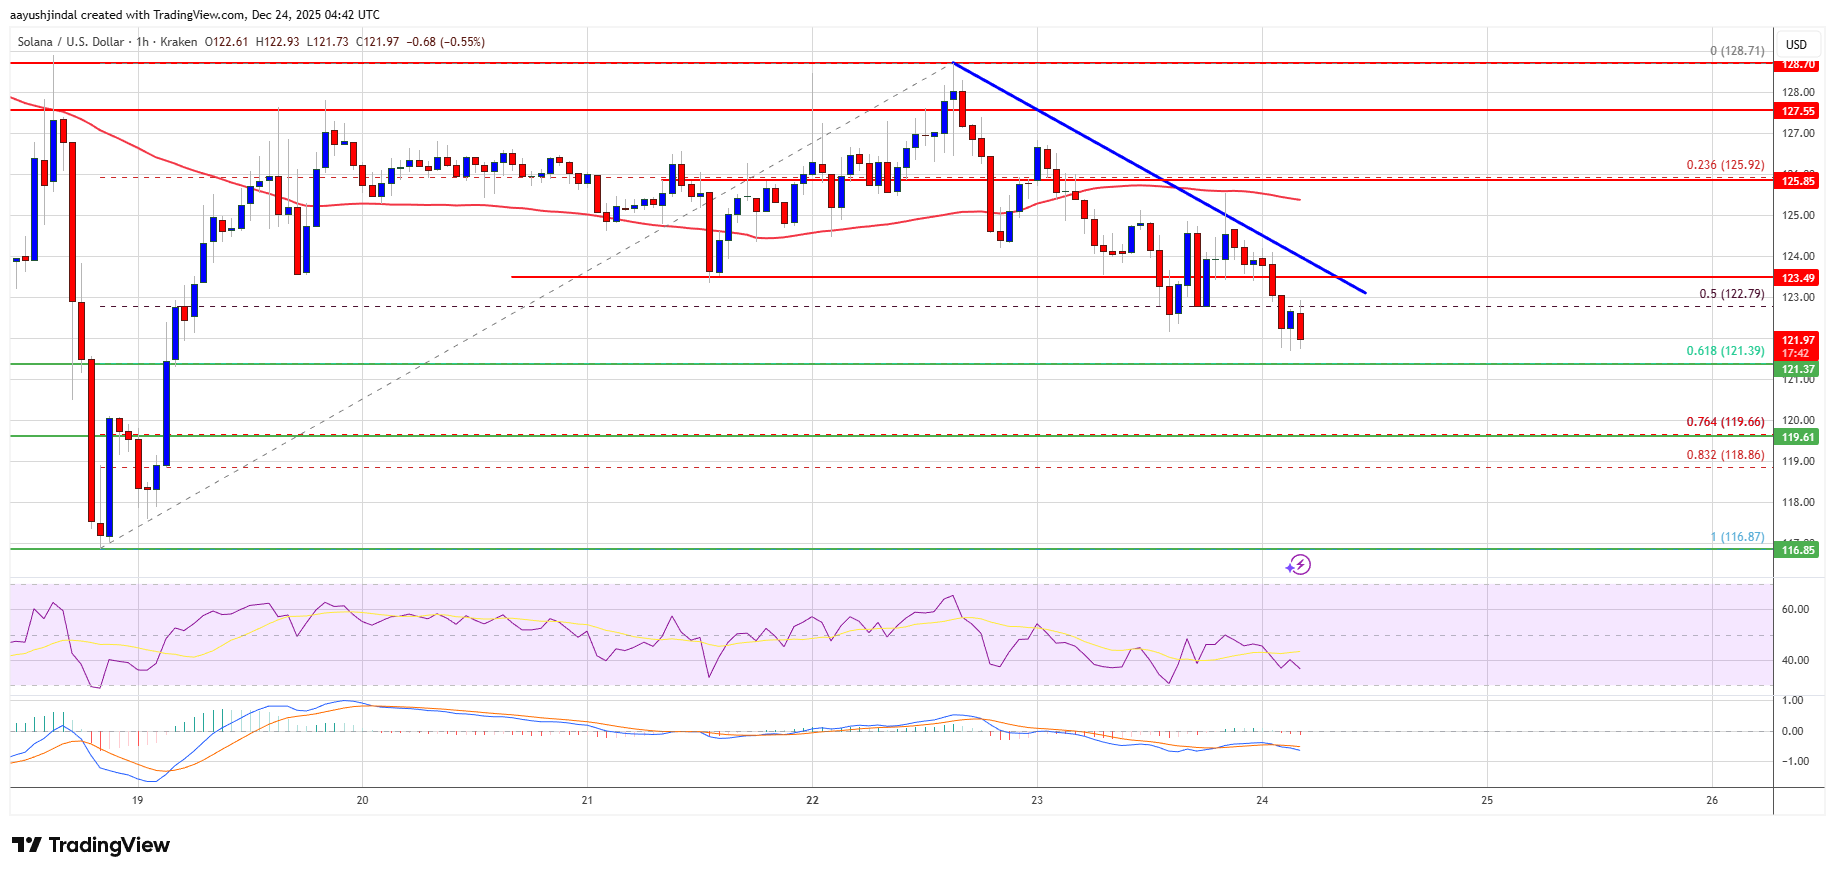
Solana is now trading below $125 and the 100-hourly simple moving average. On the upside, the price is facing resistance near the $125 level and the trend line. The next major resistance is near the $128 level. The main resistance could be $130. A successful close above the $130 resistance zone could set the pace for another steady increase. The next key resistance is $135. Any more gains might send the price toward the $142 level.
More Losses In SOL?
If SOL fails to rise above the $125 resistance, it could start another decline. Initial support on the downside is near the $122 zone. The first major support is near the $120 level and the 76.4% Fib retracement level of the upward wave from the $117 swing low to the $127 high.
A break below the $120 level might send the price toward the $112 support zone. If there is a close below the $112 support, the price could decline toward the $105 support in the near term.
Technical Indicators
Hourly MACD – The MACD for SOL/USD is gaining pace in the bearish zone.
Hourly Hours RSI (Relative Strength Index) – The RSI for SOL/USD is below the 50 level.
Major Support Levels – $122 and $120.
Major Resistance Levels – $125 and $128.


Related Articles
Bitcoin is mid-cycle bull: analyst
Macro analyst and institutional crypto veteran Dan Tapiero stated Bitcoin remains in...
El Salvador’s Bitcoin aspirations were brought closer to earth in 2025
Four years ago, El Salvador started its ambitious Bitcoin adoption strategy. But...

Why OTC desks are becoming essential for large crypto trades
As market volatility and liquidity fragmentation persist, OTC desks are increasingly used...
BlackRock deposits $200M in Bitcoin and $29M in Ethereum to Coinbase Prime
BlackRock’s significant crypto deposits may signal a strategic shift to bolster its...
Leave a comment