- Home
- Advertise With us
- World News
- Tech
- Entertainment
- Travels & Tours
- Contact US
- About us
- Privacy Policy
Top Insights
Ripple Price at Crossroads: Will XRP Rip or Dump Next?

TL;DR
- XRP retests a major breakout level after forming an ascending triangle on the daily chart.
- EGRAG CRYPTO outlines two scenarios, with price targets ranging from $2.65 to $3.70.
- A close above $3.13 may cancel bearish signals and confirm the next bullish wave.
XRP Breaks Out of Downward Channel
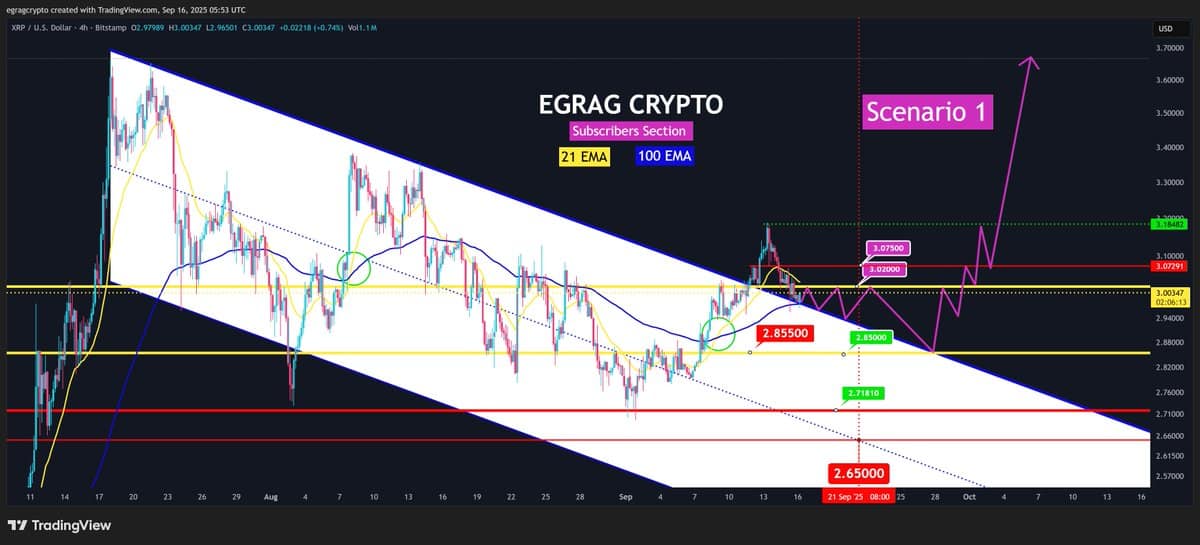
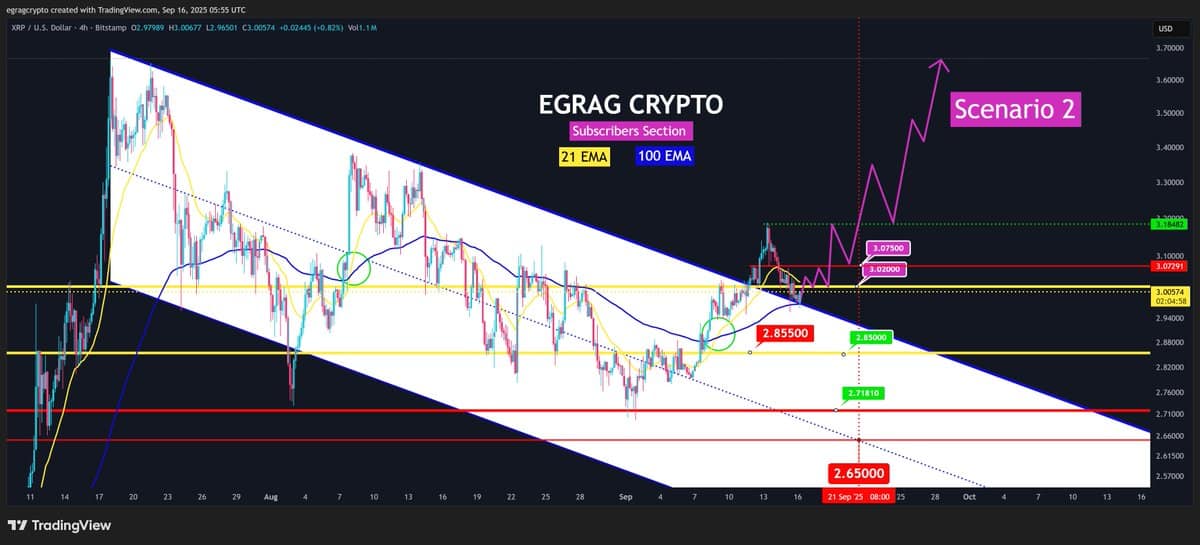
XRP has recently moved above the upper edge of a long-standing downward channel. The move follows a chart pattern known as an ascending triangle, often seen before price increases. This breakout is now being tested, as the price returns toward the top of the same channel.
Analyst EGRAG CRYPTO shared that this retest is happening at a lower level than the breakout point. This change is expected, as the slope of the descending channel lowers over time. The key question now is whether XRP can stay above this zone or slip back into the range it just escaped.
#XRP Cross & Push ( What’s Next):
Here’s a step-by-step breakdown of how I built my analysis and anticipated the upcoming move under the post Titled ” Cross & Push)
Go through the thread and take a look!
and get into the details and explore what’s likely to happen… pic.twitter.com/wTuisEjziF
— EGRAG CRYPTO (@egragcrypto) September 16, 2025
Notably, support appears strong at $2.85, but there is room for a drop to $2.65 if sellers take control. EGRAG CRYPTO warned that this lower level could be reached if XRP cannot hold above short-term resistance.
The first resistance level to monitor is $3.02.
“We need to see a close above $3.07 and $3.13. If we can achieve that, we’ll be in a much stronger position,” EGRAG said.
Holding above these levels would help cancel out the risk of a continued pullback and could set the stage for a higher move.
Two Clear Price Scenarios Ahead
Two price paths are now possible. In the first, XRP breaks below $2.85 and moves toward $2.65. This would confirm a bearish shift, but it could also lead to a bounce. A return above $3.02, $3.07, and then $3.13 would signal a strong recovery and open the way to higher targets, possibly around $3.70.

The second scenario avoids a deeper drop. XRP would hold above $2.85 and slowly climb past $3.02. If buyers push it through $3.07 and $3.13, the chart would confirm a breakout and support continued growth without further correction.

Moving Averages Hold the Key
The 100 EMA is acting as short-term support, helping keep XRP steady. At the same time, the 21 EMA is showing signs of flattening. If the two lines cross downward, it could push the price lower. This would make a close above $3.07 and $3.13 even more critical in the days ahead.
Alongside chart patterns and moving averages, EGRAG CRYPTO has also shared an update based on Elliott Wave structure. CryptoPotato has previously covered this Elliott Wave framework in detail.
Traders are now focused on the next few candles. If XRP can clear these resistance levels soon, the trend may turn more clearly in favor of buyers. If not, the lower support levels may be tested before the market decides its next direction.
The post Ripple Price at Crossroads: Will XRP Rip or Dump Next? appeared first on CryptoPotato.
Related Articles
Binance seeks early exit from DOJ’s watchful eye
Binance is reportedly negotiating an early termination of its court-appointed compliance monitor....
Why Solana Treasury Companies May Outshine BTC and ETH in 2025
Analysts have forecasted that Solana (SOL) treasury companies might outshine Bitcoin (BTC)...
Circle responds to Hyperliquid’s stablecoin with investment, native USDC rollout
Circle is now a HYPE holder, has introduced native USDC to Hyperliquid...
Analyst Sounds Major XRP Warning: Last Chance To Get In As Accumulation Balloons
Analyst Austin Hilton has sounded a major XRP warning even as the...


 and get into the details and explore what’s likely to happen…


Leave a comment