


ETH MACD Crossover Sparks Talk of 2021-Style Rally

TL;DR
- Ethereum repeats its 2020 breakout setup, fueling expectations of a potential major rally.
- Monthly MACD crossover and RSI near 52 show ETH may have more room to climb.
- ETH defends 50-day EMA at $4,164, maintaining strong support across all key moving averages.
Ethereum Shows Monthly MACD Crossover
Ethereum (ETH) has printed a fresh crossover on the monthly MACD indicator, which some market analysts see as a potential turning point. Crypto trader Merlijn The Trader called the move a “monster ignition” and pointed to the completion of a multi-year consolidation phase.
ETHEREUM IS CHARGING THE MONSTER MOVE
Fresh MACD crossover.
3-year squeeze at apex.
Monthly candle screaming bullish.Break $4,450 and $ETH doesn’t walk… it rips.
Don’t call it hopium. Call it ignition. pic.twitter.com/kKgug4l34p— Merlijn The Trader (@MerlijnTrader) September 8, 2025
Remarkably, the MACD crossover on the monthly chart is considered rare, especially following a three-year squeeze. The last time this occurred was before the 2020–2021 rally, where Ethereum moved sharply higher over several months. ETH is now trading near a key level of $4,450, which marks the top of its long-standing resistance range.
Ethereum’s recent breakout and pullback appear similar to its price behavior during the 2020–2021 cycle. Back then, ETH broke out of a long downtrend, retested its breakout level, and then started a steep climb to new highs.
Charts shared by Merlijn The Trader show that Ethereum has again broken above a downward trendline and returned to test former resistance near $3,650–$4,000. The trader noted, “2021 gave us the pattern. 2025 gives us the chance,” suggesting that the setup may lead to a repeat of previous price behavior.
ETHEREUM IS REPEATING HISTORY
2021 showed us the pattern.
2025 is showing us the opportunity.The retest is where legends buy.
The breakout is where fortunes are made.$ETH isn’t done. It’s just getting started. pic.twitter.com/81TVrNlp70— Merlijn The Trader (@MerlijnTrader) August 29, 2025
While comparisons to past cycles offer perspective, Ethereum would still need to confirm strength above $4,450 to open the door for further upside.
ETH Holds Strong as Momentum Builds
ETH recently bounced from its 50-day exponential moving average, which is now acting as support around $4,164. The ability to stay above this level shows that buyers are still active and defending key zones.
Notably, the price is also positioned above all other major EMAs (20, 50, 100, and 200), which gives it a strong technical base. Holding these levels often reflects trend stability and provides structure for future moves.
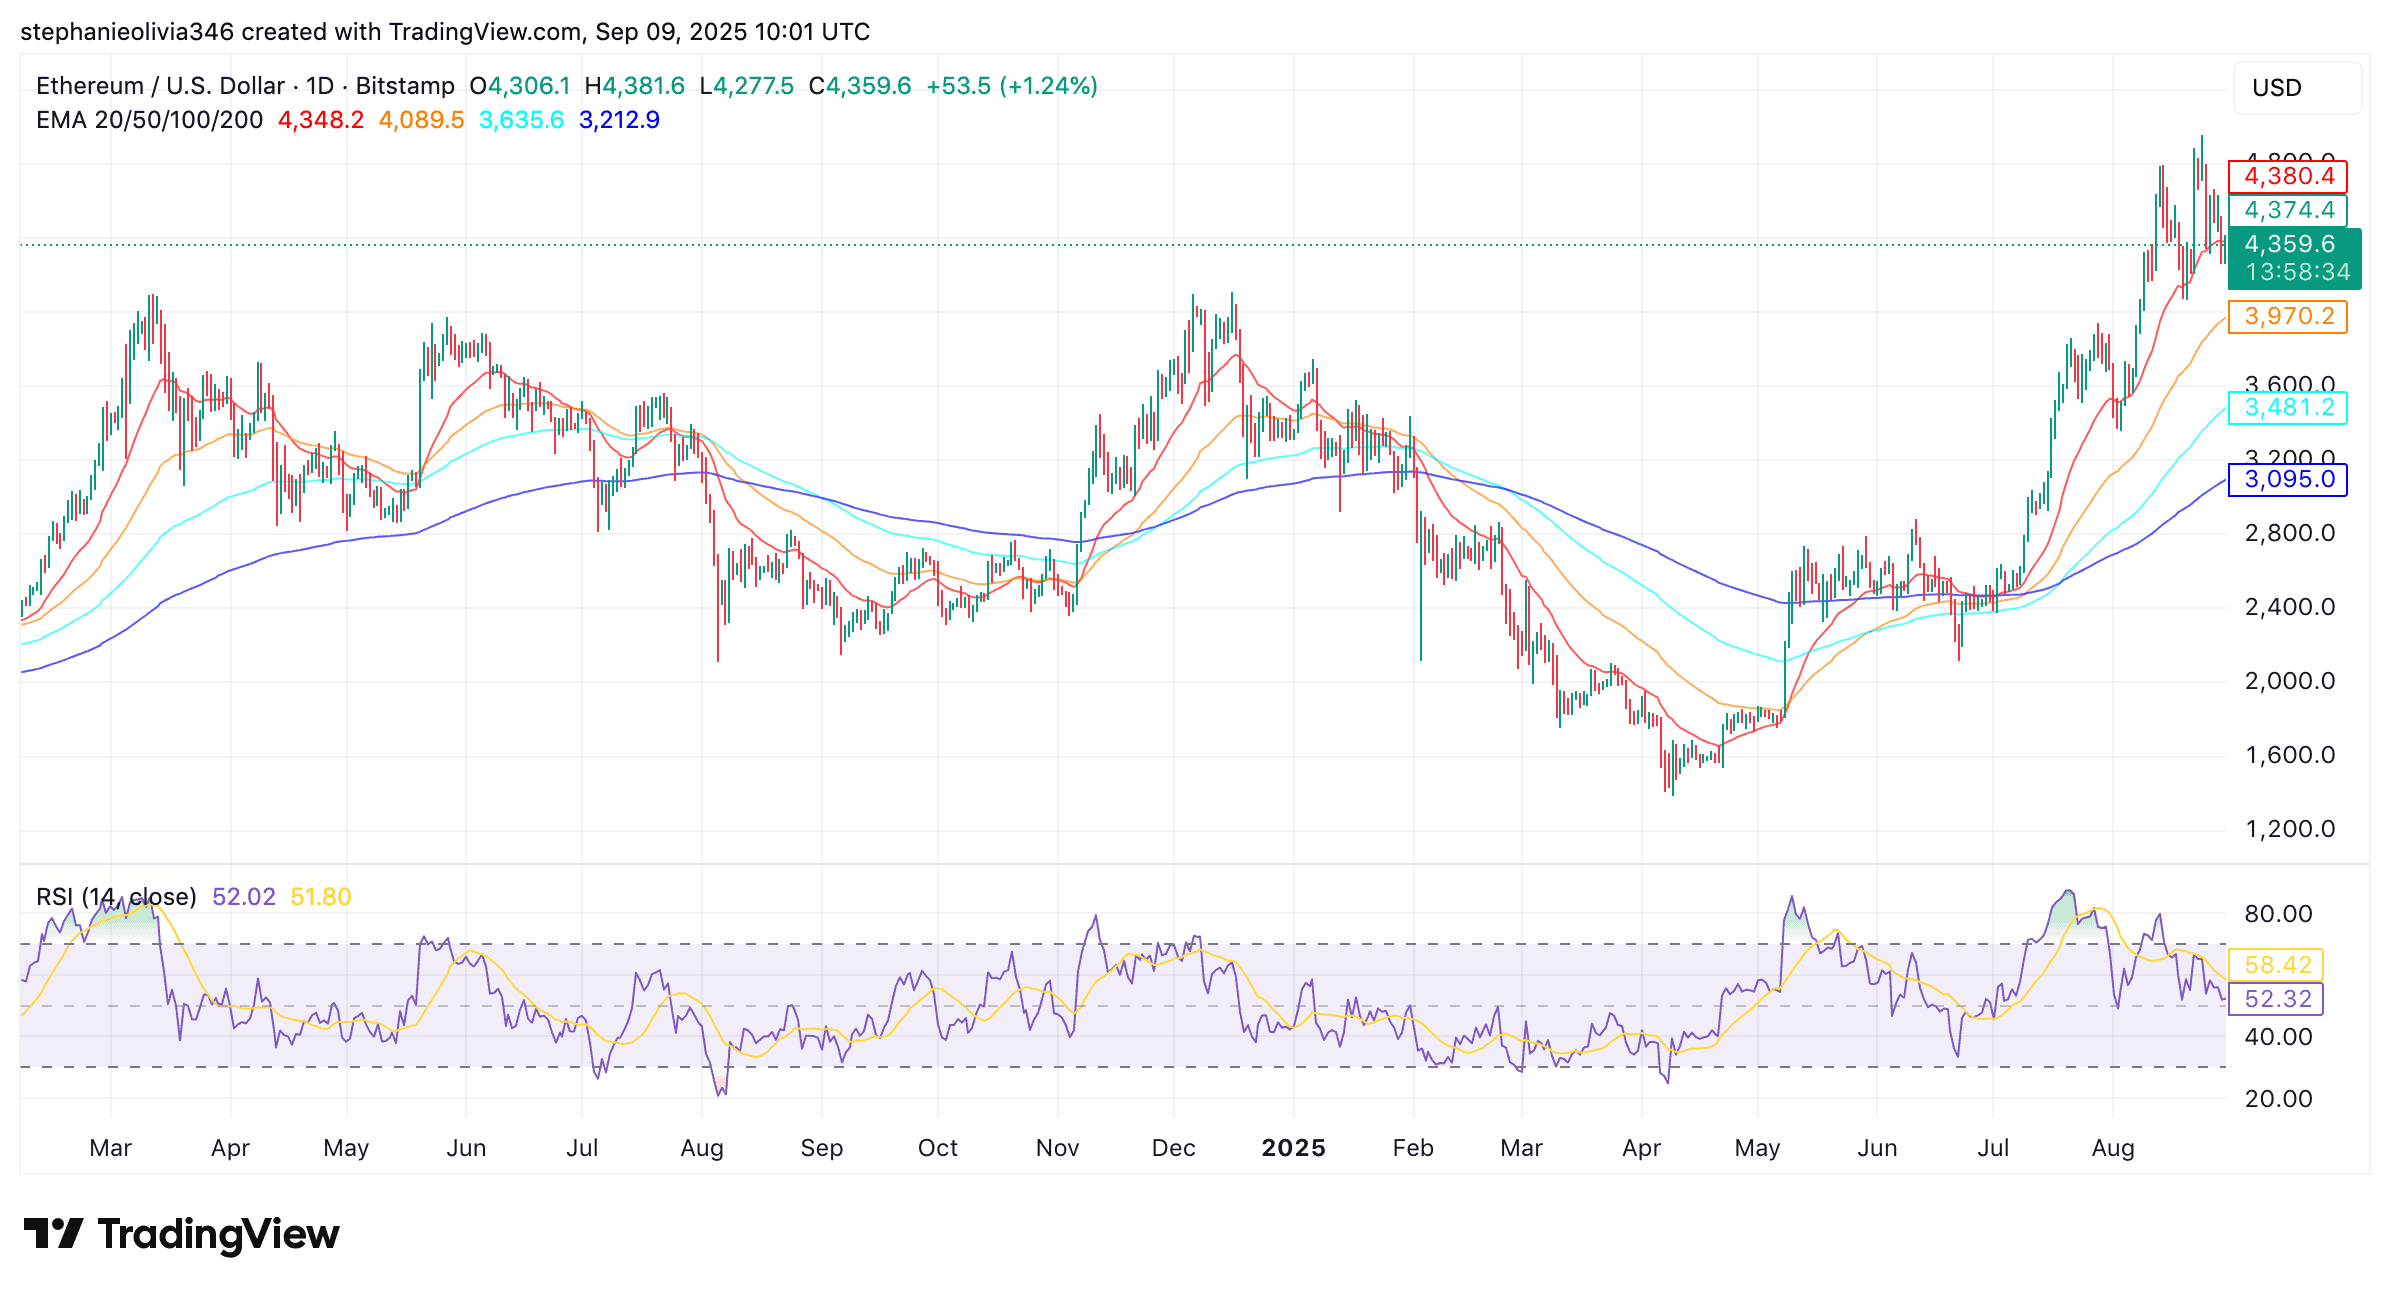
Meanwhile, the daily Relative Strength Index (RSI) sits at 52. This neutral zone shows that the market is balanced, with neither strong buying nor selling pressure. In previous market cycles, similar RSI levels during uptrends allowed for gradual price increases without the need for a deep correction.
As of press time, Ethereum was priced at around $4,360. It has gained 1% in the last 24 hours, while showing a slight weekly decline. Trading volume over the past day is $30.36 billion.
The post ETH MACD Crossover Sparks Talk of 2021-Style Rally appeared first on CryptoPotato.
Related Articles

SEC pushes back decisions on Bitwise, Grayscale crypto ETFs to November
The SEC extended its review of the Bitwise Dogecoin and Grayscale Hedera...

Crypto bets send QMMM up 1,700%, Sol Strategies down 42% on Nasdaq
The split underscores uneven price performance among publicly traded companies betting on...

Crypto-Stealing Malware Infiltrates Core JavaScript Libraries Used by Millions
The NPM (node packet manager) account of developer ‘qix’ was compromised, allowing...

Eric Trump scaling back role at crypto firm ALT5 Sigma
The initial deal between ALT5 and World Liberty Financial included Eric Trump...
Leave a comment