


BNB Price Surges to Fresh ATH – Can Bulls Push Toward $1K?

BNB price is gaining pace above the $885 zone. The price is now showing positive signs and might aim for a move above the $920 level in the near term.
- BNB price started a fresh increase above the $880 and $900 levels.
- The price is now trading above $900 and the 100-hourly simple moving average.
- There is a key bullish trend line forming with support at $898 on the hourly chart of the BNB/USD pair (data source from Binance).
- The pair must stay above the $885 level to start another increase in the near term.
BNB Price Extends Gains
BNB price formed a base above the $850 level and started a fresh increase, beating Ethereum and Bitcoin. There was a steady move above the $870 and $885 levels.
The bulls even cleared the $895 resistance zone. A new all-time high was formed at $908 and the price is now consolidating gains. It is trading near the 23.6% Fib retracement level of the upward move from the $888 swing low to the $908 high.
The price is now trading above $900 and the 100-hourly simple moving average. Besides, there is a key bullish trend line forming with support at $898 on the hourly chart of the BNB/USD pair.
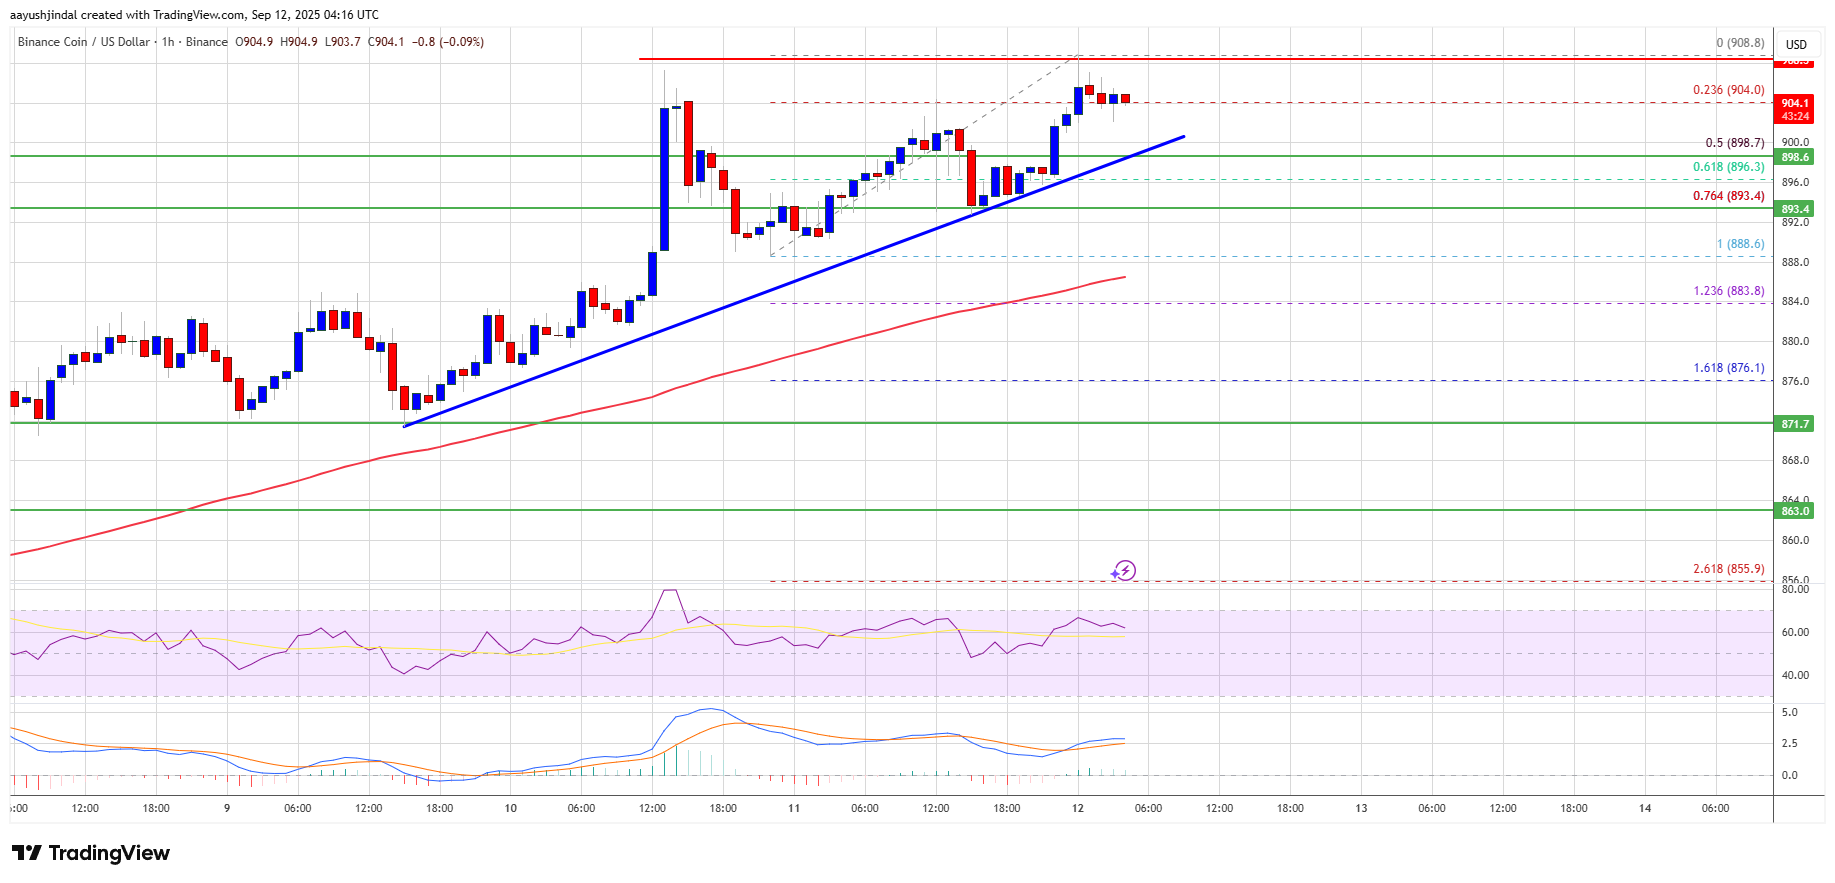
On the upside, the price could face resistance near the $908 level. The next resistance sits near the $912 level. A clear move above the $912 zone could send the price higher. In the stated case, BNB price could test $920. A close above the $920 resistance might set the pace for a larger move toward the $945 resistance. Any more gains might call for a test of the $1,000 handle in the near term.
Short-Term Pullback?
If BNB fails to clear the $908 resistance, it could start another decline. Initial support on the downside is near the $898 level. The next major support is near the $893 level or the 76.4% Fib retracement level of the upward move from the $888 swing low to the $908 high.
The main support sits at $888. If there is a downside break below the $888 support, the price could drop toward the $872 support. Any more losses could initiate a larger decline toward the $865 level.
Technical Indicators
Hourly MACD – The MACD for BNB/USD is gaining pace in the bullish zone.
Hourly RSI (Relative Strength Index) – The RSI for BNB/USD is currently above the 50 level.
Major Support Levels – $898 and $888.
Major Resistance Levels – $908 and $920.

Related Articles

Sam Bankman-Fried launched appeal to 25-year prison sentence
One of crypto’s biggest courtroom dramas is set to resume, as Sam...

China’s MOGU stock explodes 84% after $20m crypto buy
China-based fashion company MOGU saw its stock reach above 80% after it...

Cardano Is Not Dead: Analyst Confirms Breakout With New ADA Price Targets
The Cardano (ADA) price is still holding up quite nicely and has...

APT Miner highlights cloud mining features for global users
APT Miner highlights how XRP’s growing role in global finance can be...
Leave a comment