

Bitcoin Price Under Pressure – Charts Turn Bearish As Bulls Lose Control

Bitcoin price corrected losses and traded above the $115,000 level. BTC is now struggling and might start another decline below $110,000.
- Bitcoin started a fresh decline after it failed to clear the $116,000 resistance level.
- The price is trading below $115,000 and the 100 hourly Simple moving average.
- There is a bearish trend line forming with resistance at $118,250 on the hourly chart of the BTC/USD pair (data feed from Kraken).
- The pair might continue to move down if it trades below the $110,500 zone.
Bitcoin Price Faces Resistance
Bitcoin price started a recovery wave above the $112,000 resistance level. BTC recovered above the $112,500 and $113,200 resistance levels.
The price climbed above the 61.8% Fib retracement level of the downward move from the $122,498 swing high to the $100,000 low. The bulls even pushed the price above the $115,000 resistance level. However, there are many hurdles on the upside.
Bitcoin is now trading below $115,000 and the 100 hourly Simple moving average. Besides, there is a bearish trend line forming with resistance at $118,250 on the hourly chart of the BTC/USD pair.
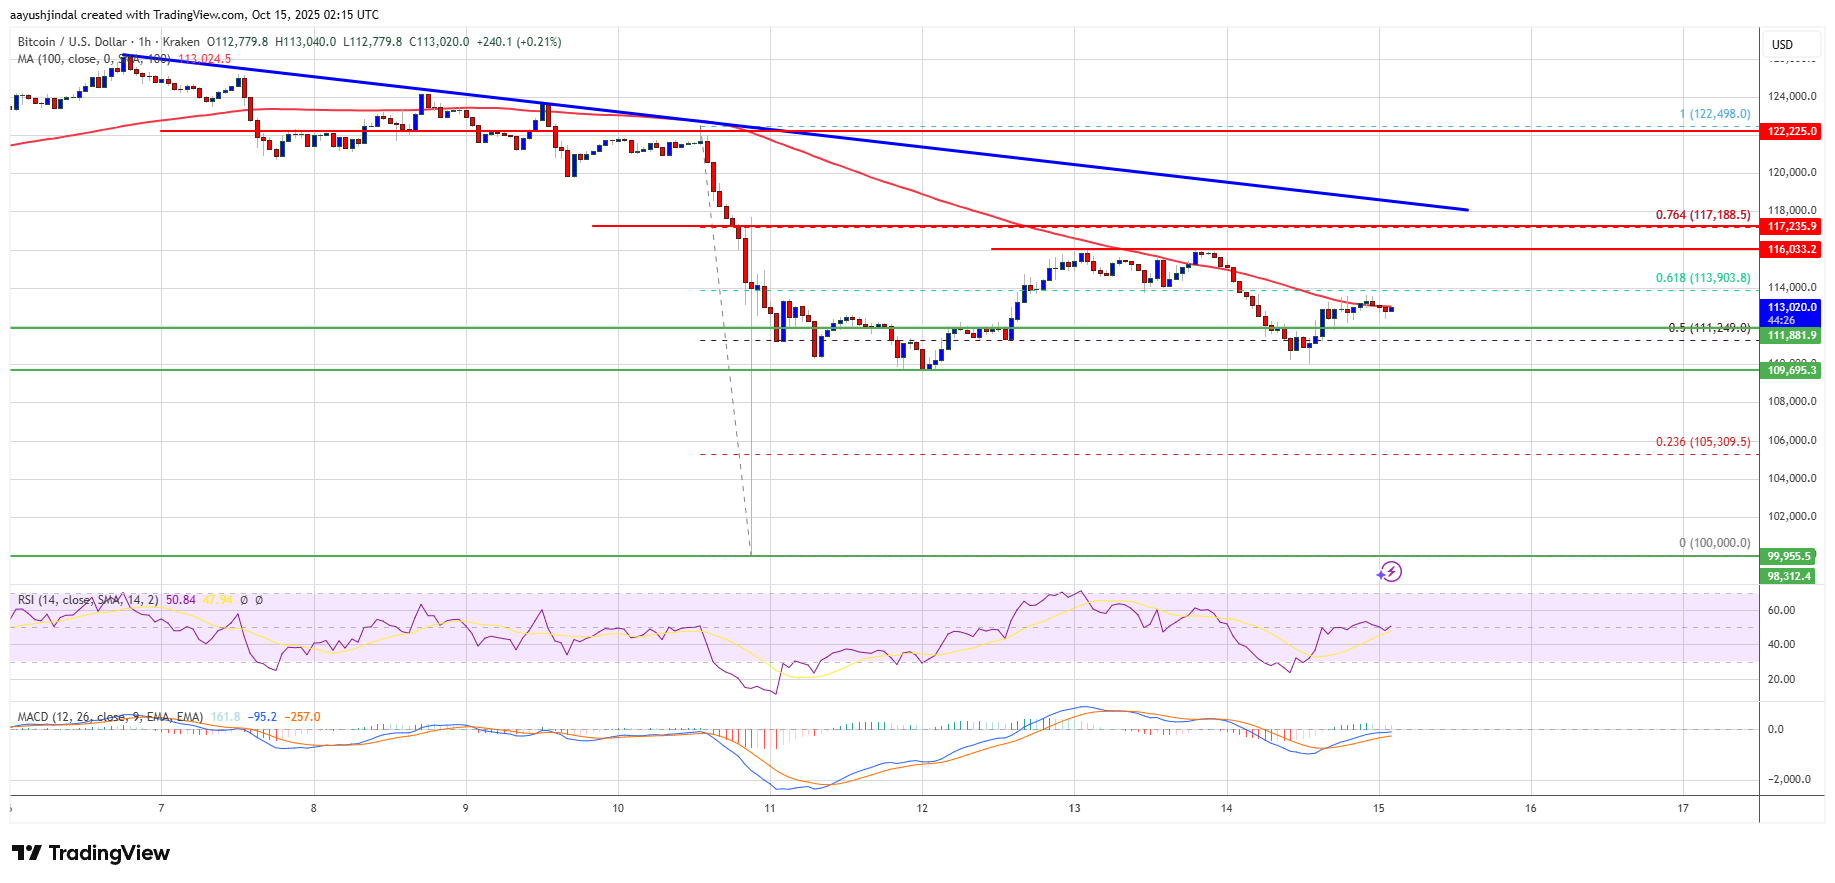
Immediate resistance on the upside is near the $114,000 level. The first key resistance is near the $115,000 level. The next resistance could be $116,000. A close above the $116,000 resistance might send the price further higher. In the stated case, the price could rise and test the $117,200 resistance and the 76.4% Fib retracement level of the downward move from the $122,498 swing high to the $100,000 low. Any more gains might send the price toward the $117,250 level. The next barrier for the bulls could be $118,500.
Another Drop In BTC?
If Bitcoin fails to rise above the $116,000 resistance zone, it could start a fresh decline. Immediate support is near the $111,800 level. The first major support is near the $110,500 level.
The next support is now near the $110,200 zone. Any more losses might send the price toward the $108,500 support in the near term. The main support sits at $107,000, below which BTC might struggle to recover in the short term.
Technical indicators:
Hourly MACD – The MACD is now gaining pace in the bearish zone.
Hourly RSI (Relative Strength Index) – The RSI for BTC/USD is now below the 50 level.
Major Support Levels – $111,800, followed by $110,500.
Major Resistance Levels – $115,000 and $116,000.
Related Articles

What’s Driving The Drop? Bitcoin, Ethereum, And XRP Struggle Amid Market Uncertainty
After beginning the week above the critical $115,000 mark, Bitcoin (BTC) and...

Ether set to go ‘nuclear’ with 3 active ‘supply vacuums’ — Analyst
The supply of Ether is being pressured like never before, and with...

Dogecoin (DOGE) Resilient Above $0.20 – Can Momentum Shift Toward Fresh Upside?
Dogecoin started a fresh increase above the $0.20 zone against the US...

Fidelity purchases $132.7 million in Bitcoin
Fidelity’s Bitcoin acquisition signals growing institutional trust in crypto, potentially influencing broader...
Leave a comment