


Bitcoin Price Recovery Runs Out of Steam, Leaving Bears Ready to Strike

Bitcoin price started a recovery wave above $90,000. BTC is now struggling to clear $92,000 and might start another decline below $90,000.
- Bitcoin started a recovery wave and climbed toward $92,000.
- The price is trading above $90,000 and the 100 hourly Simple moving average.
- There was a break below a short-term bullish trend line with support at $90,800 on the hourly chart of the BTC/USD pair (data feed from Kraken).
- The pair might continue to move down if it settles below the $90,000 zone.
Bitcoin Price Faces Resistance
Bitcoin price managed to stay above the $88,500 level. BTC formed a base and recently started a recovery wave above the $90,000 resistance zone.
The pair climbed above the $91,000 level. A high was formed at $91,878 and the price is now correcting some gains. There was a break below a short-term bullish trend line with support at $90,800 on the hourly chart of the BTC/USD pair.
The pair is now approaching the 23.6% Fib retracement level of the upward move from the $86,299 swing low to the $91,878 high. Bitcoin is now trading above $90,000 and the 100 hourly Simple moving average. If the bulls remain in action, the price could attempt another increase.
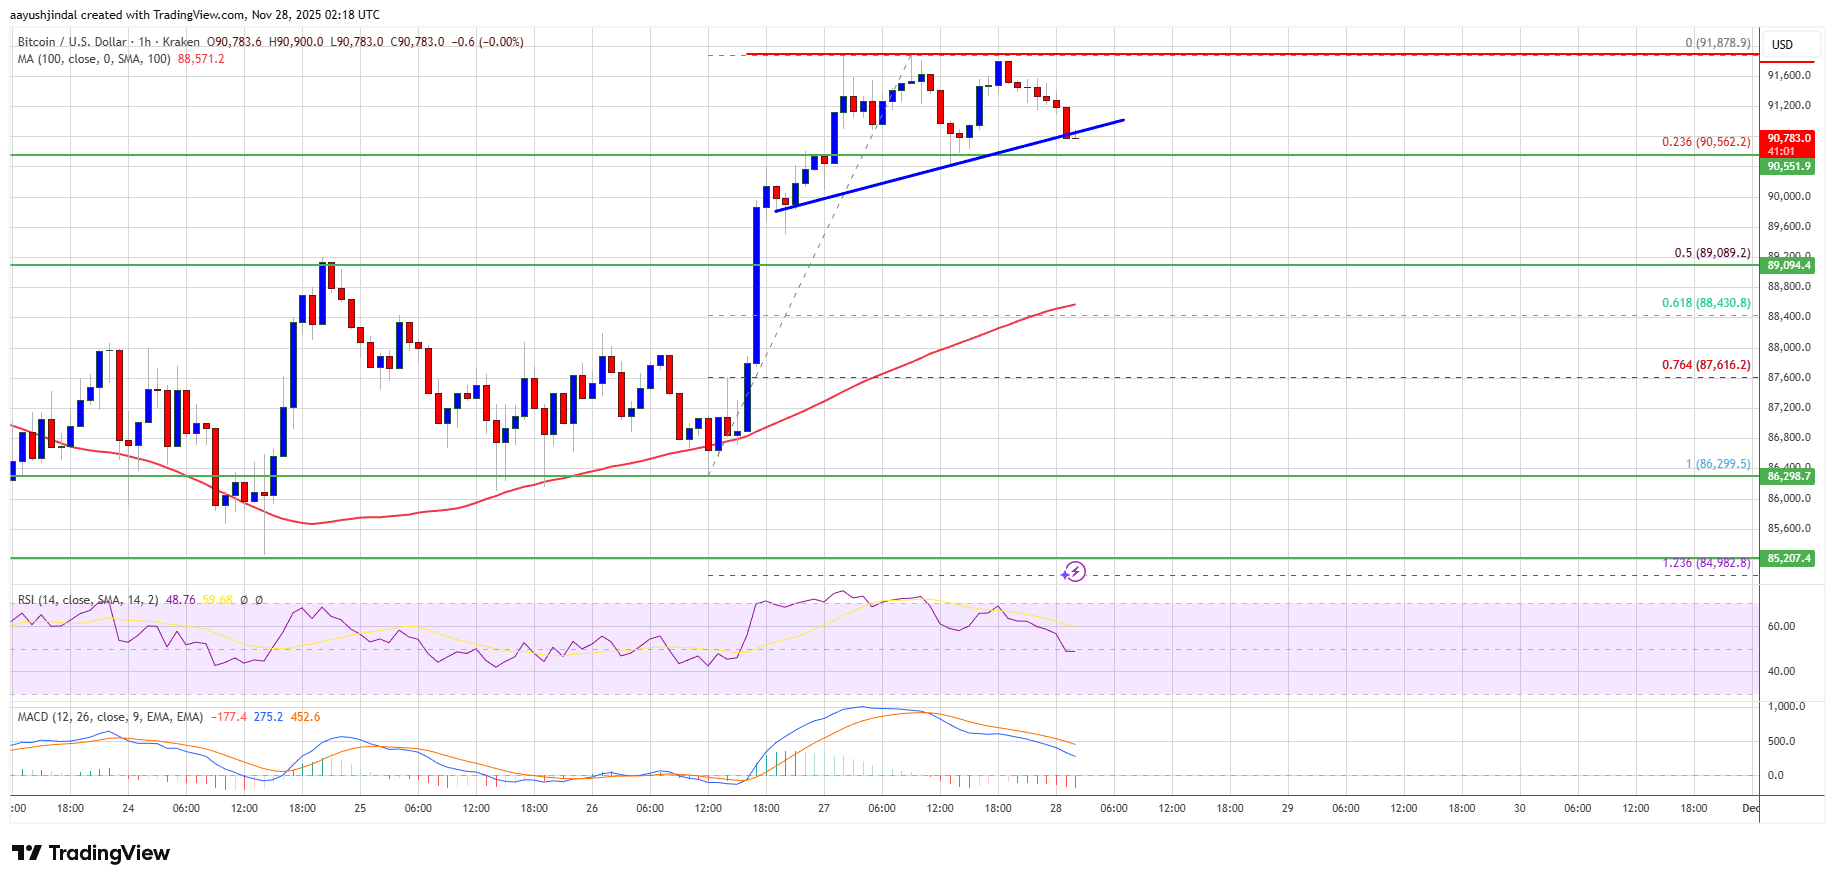
Immediate resistance is near the $91,200 level. The first key resistance is near the $92,000 level. The next resistance could be $92,500. A close above the $92,500 resistance might send the price further higher. In the stated case, the price could rise and test the $93,750 resistance. Any more gains might send the price toward the $94,500 level. The next barrier for the bulls could be $95,000 and $95,500.
More Losses In BTC?
If Bitcoin fails to rise above the $92,000 resistance zone, it could start another decline. Immediate support is near the $90,500 level. The first major support is near the $89,080 level or the 50% Fib retracement level of the upward move from the $86,299 swing low to the $91,878 high.
The next support is now near the $88,450 zone. Any more losses might send the price toward the $87,500 support in the near term. The main support sits at $86,300, below which BTC might accelerate lower in the near term.
Technical indicators:
Hourly MACD – The MACD is now losing pace in the bullish zone.
Hourly RSI (Relative Strength Index) – The RSI for BTC/USD is now below the 50 level.
Major Support Levels – $89,080, followed by $88,450.
Major Resistance Levels – $91,200 and $92,000.


Related Articles

Balancer to repay liquidity providers $8M in recovered funds after $128M v2 exploit
A new proposal on Balancer’s governance forum sets the stage for how...

Switzerland delays crypto tax info sharing until 2027
Switzerland will enshrine a global crypto tax sharing framework into law on...

Ethereum Trades Steady at $3K as Market Eyes Imminent Volatility Shift
Ethereum price started a recovery wave and surged above $3,000. ETH might...

Bitcoin Could Be At Risk Of A Deeper Bear If This Ratio Compresses, Says Glassnode
On-chain analytics firm Glassnode has revealed in a report how long-term Bitcoin...
Leave a comment