


Bitcoin Price Analysis: Is Bitcoin Due for a Reset Before Its Next Breakout??

Bitcoin has seen a significant uptrend in recent weeks, climbing steadily within its ascending channel and recently hitting a new all-time high at around $123,000.
However, signs of buyer exhaustion and potential distribution are starting to surface. From price action patterns to miner behavior and funding sentiment, the market seems to be entering a sensitive inflection point where a correction may be needed before the next leg up. Let’s break it down from the top.
By ShayanMarkets
The Daily Chart
On the daily timeframe, Bitcoin remains well inside its long-term ascending channel and recently printed a clean breakout above the $108K–$110K resistance zone. The price reached as high as $123K and is seemingly targeting the $140K area. This zone coincides with a potential area of profit-taking and the mid-line of the channel.
The market structure remains decisively bullish, with higher highs and higher lows continuing uninterrupted. The 50-day and 100-day moving averages, located around the $100K mark, are positively sloped, offering strong dynamic support just below the price.
If Bitcoin declines, this zone, along with the lower boundary of the channel, is the most probable area for a bullish reaction. Still, as long as the price holds above $108K, bulls remain in firm control, and the market might not revisit the lower boundary of the channel anytime soon.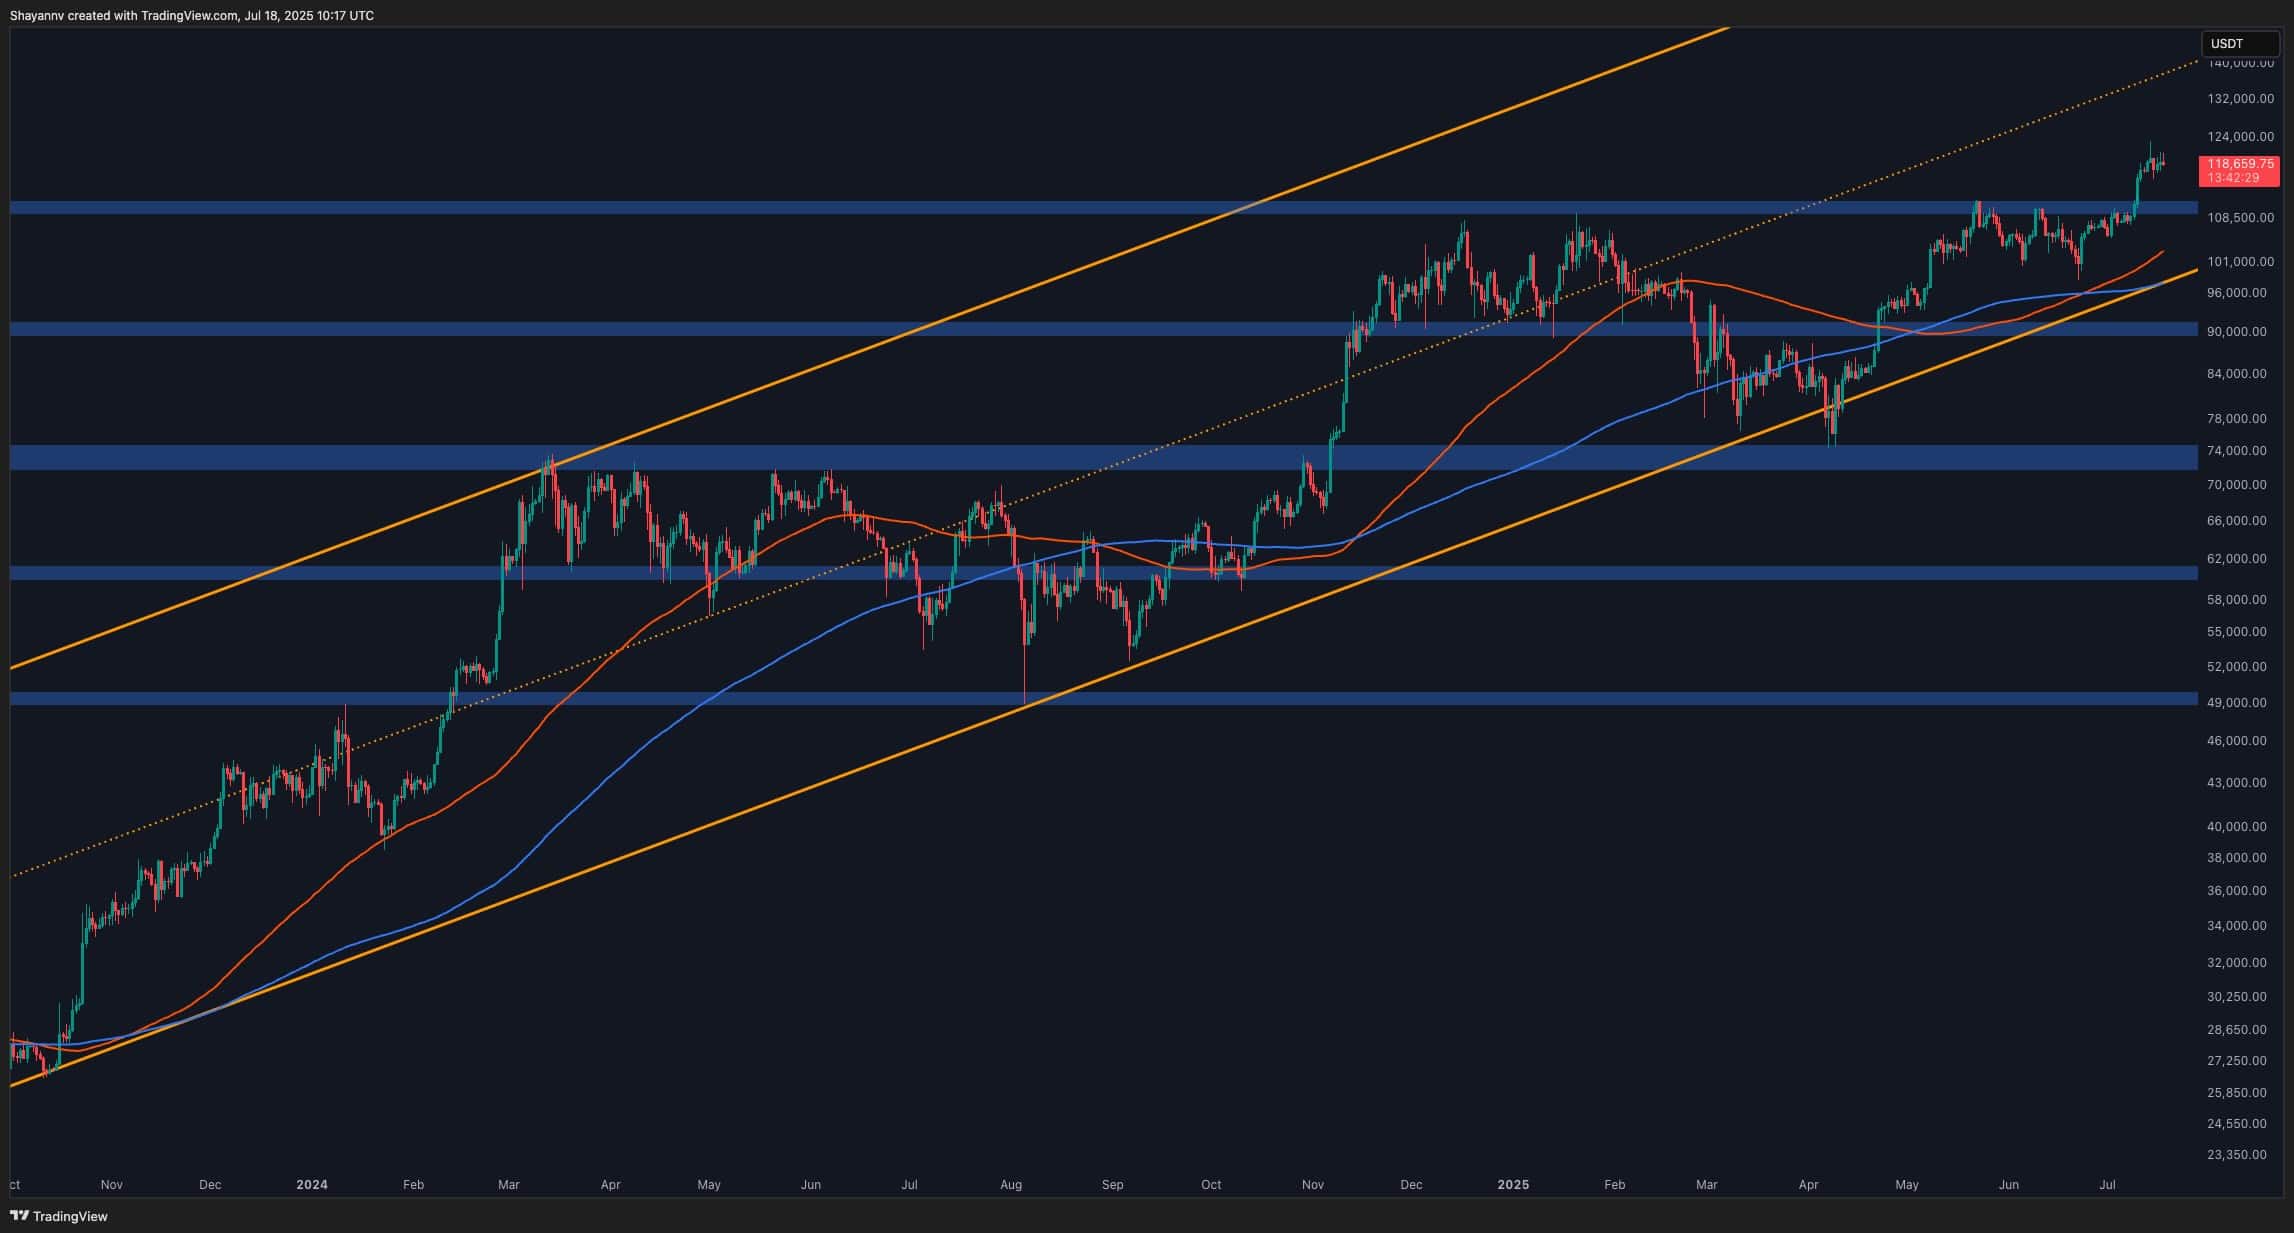
The 4-Hour Chart
The 4-hour chart reveals a developing Head and Shoulders pattern, with the left shoulder already formed, the head established near $123K, and the right shoulder currently shaping up. Importantly, this pattern is not yet confirmed, as the neckline has not been broken.
However, the structure suggests that if the neckline around the $117K–$116K low fails to hold, a bearish continuation toward the golden Fibonacci zone becomes highly probable.
The potential rebound zone lies between $112K and $111K, which corresponds to the 0.618–0.786 retracement levels. This region aligns with the base of the rally from early July, making it a confluence of both technical and psychological support.
If the neckline breaks with volume, the drop could accelerate rapidly as trapped longs exit and short-term momentum flips bearish. Until then, bulls still have time to defend the neckline and invalidate the reversal structure, but the window is narrowing.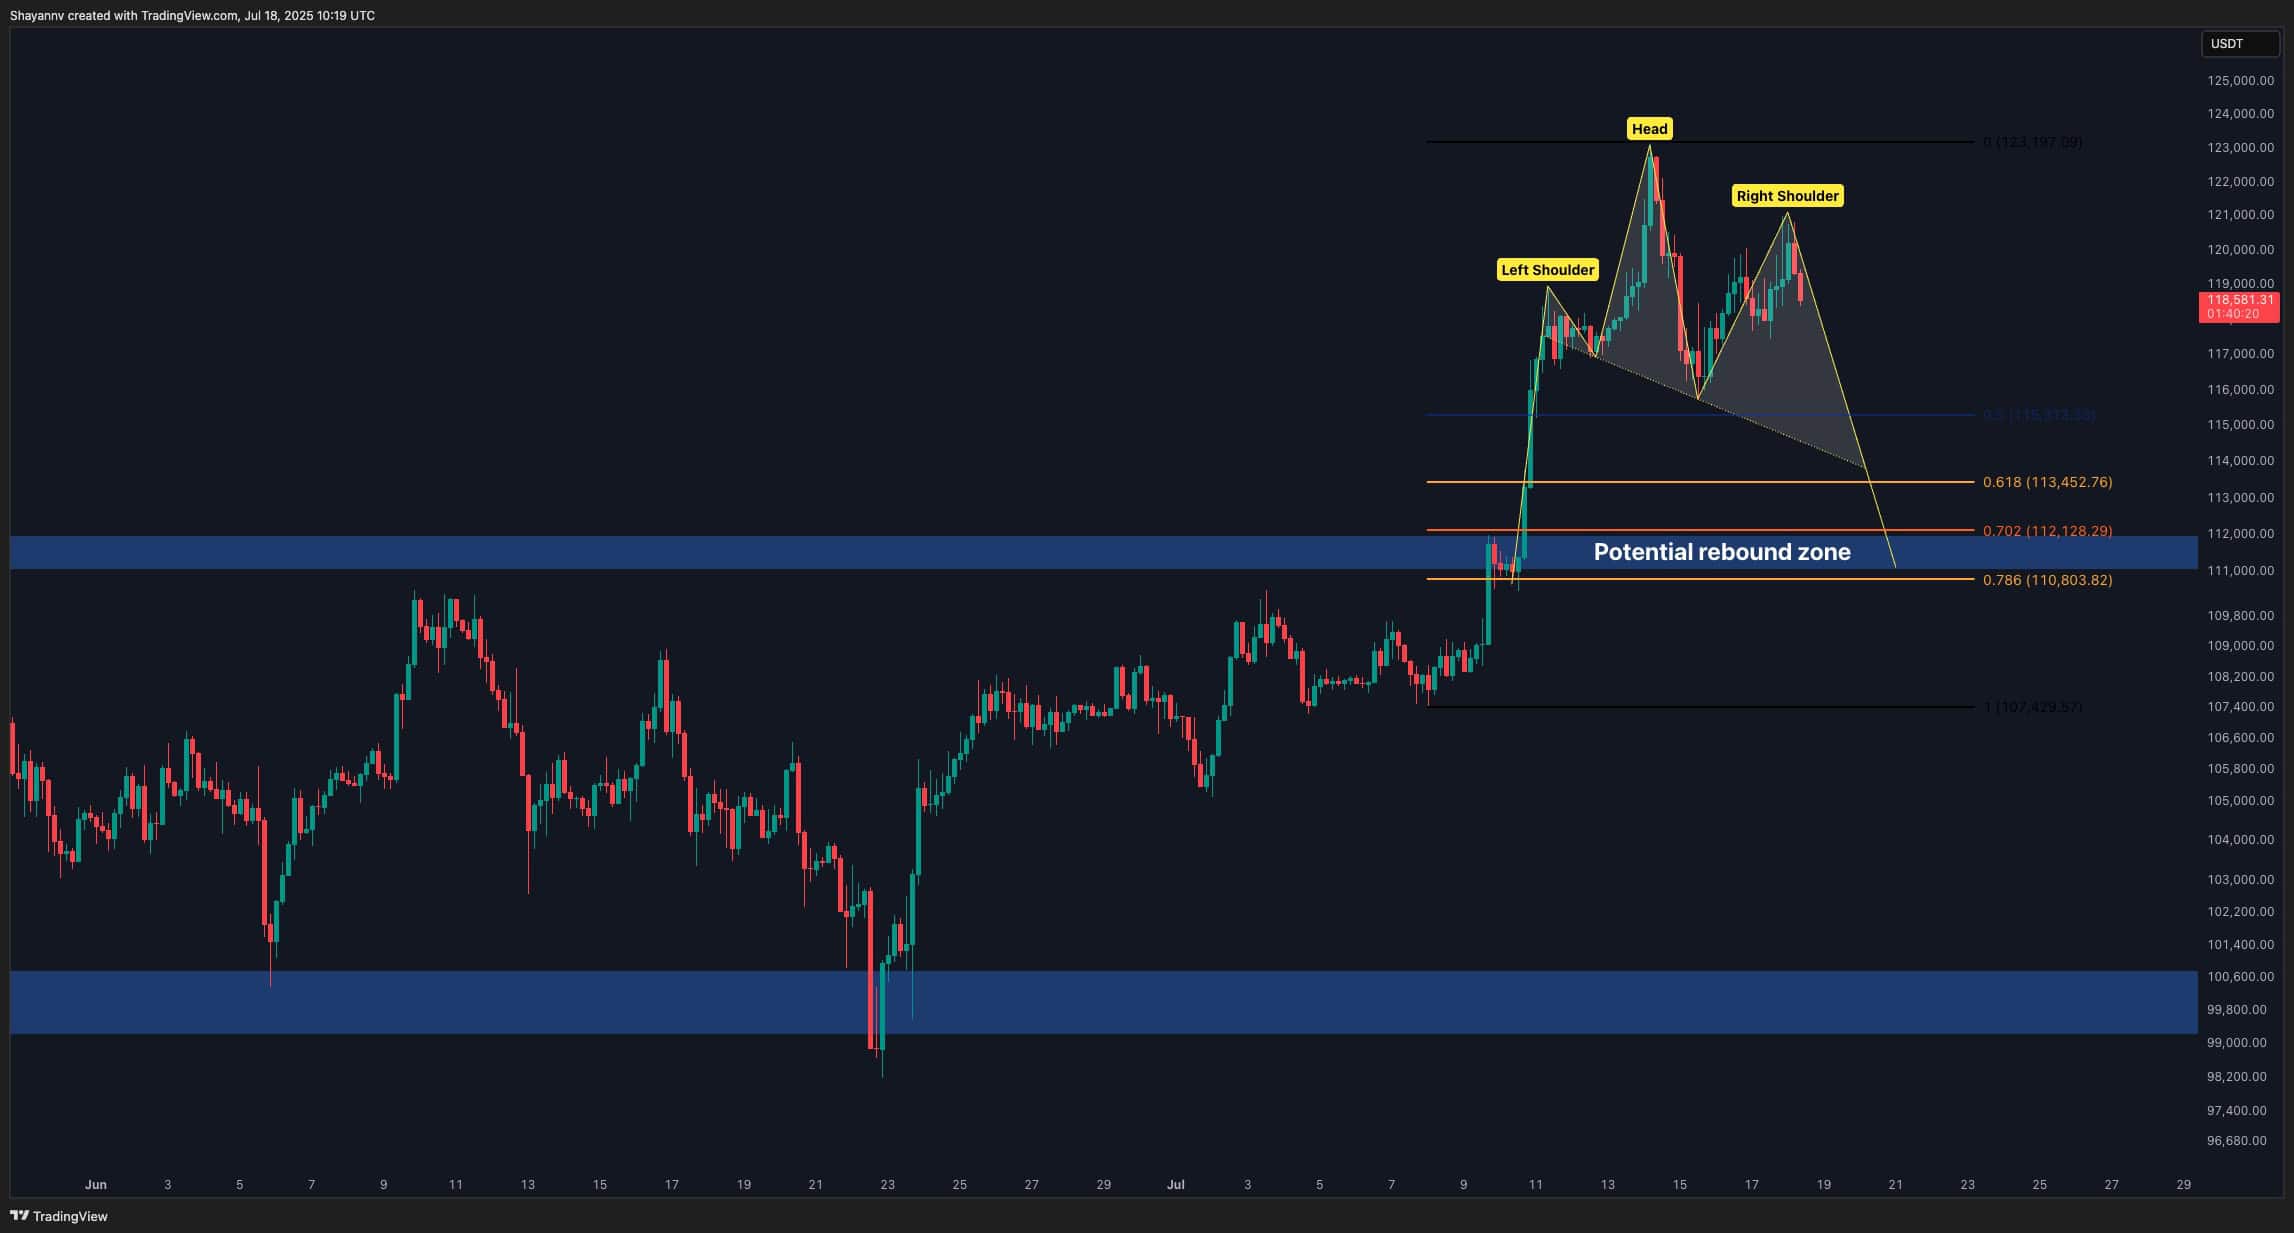
Onchain Analysis
Bitcoin Retail Activity Surge
Moving on to on-chain metrics, the Miners Position Index has spiked recently, indicating a notable rise in miner outflows to exchanges. Historically, this level marks increased selling activity from miners, often aligning with local tops or periods of cooling in the market. The timing of this spike, right as BTC tapped $123K, is not coincidental. Miners tend to offload during periods of price strength to maximize profits and fund their operations.
This kind of on-chain behavior often precedes either a local top or a sideways grind while the market absorbs this supply. It doesn’t necessarily mean a macro reversal is coming, but it does raise short-term caution, especially when paired with overheated funding and slowing spot momentum.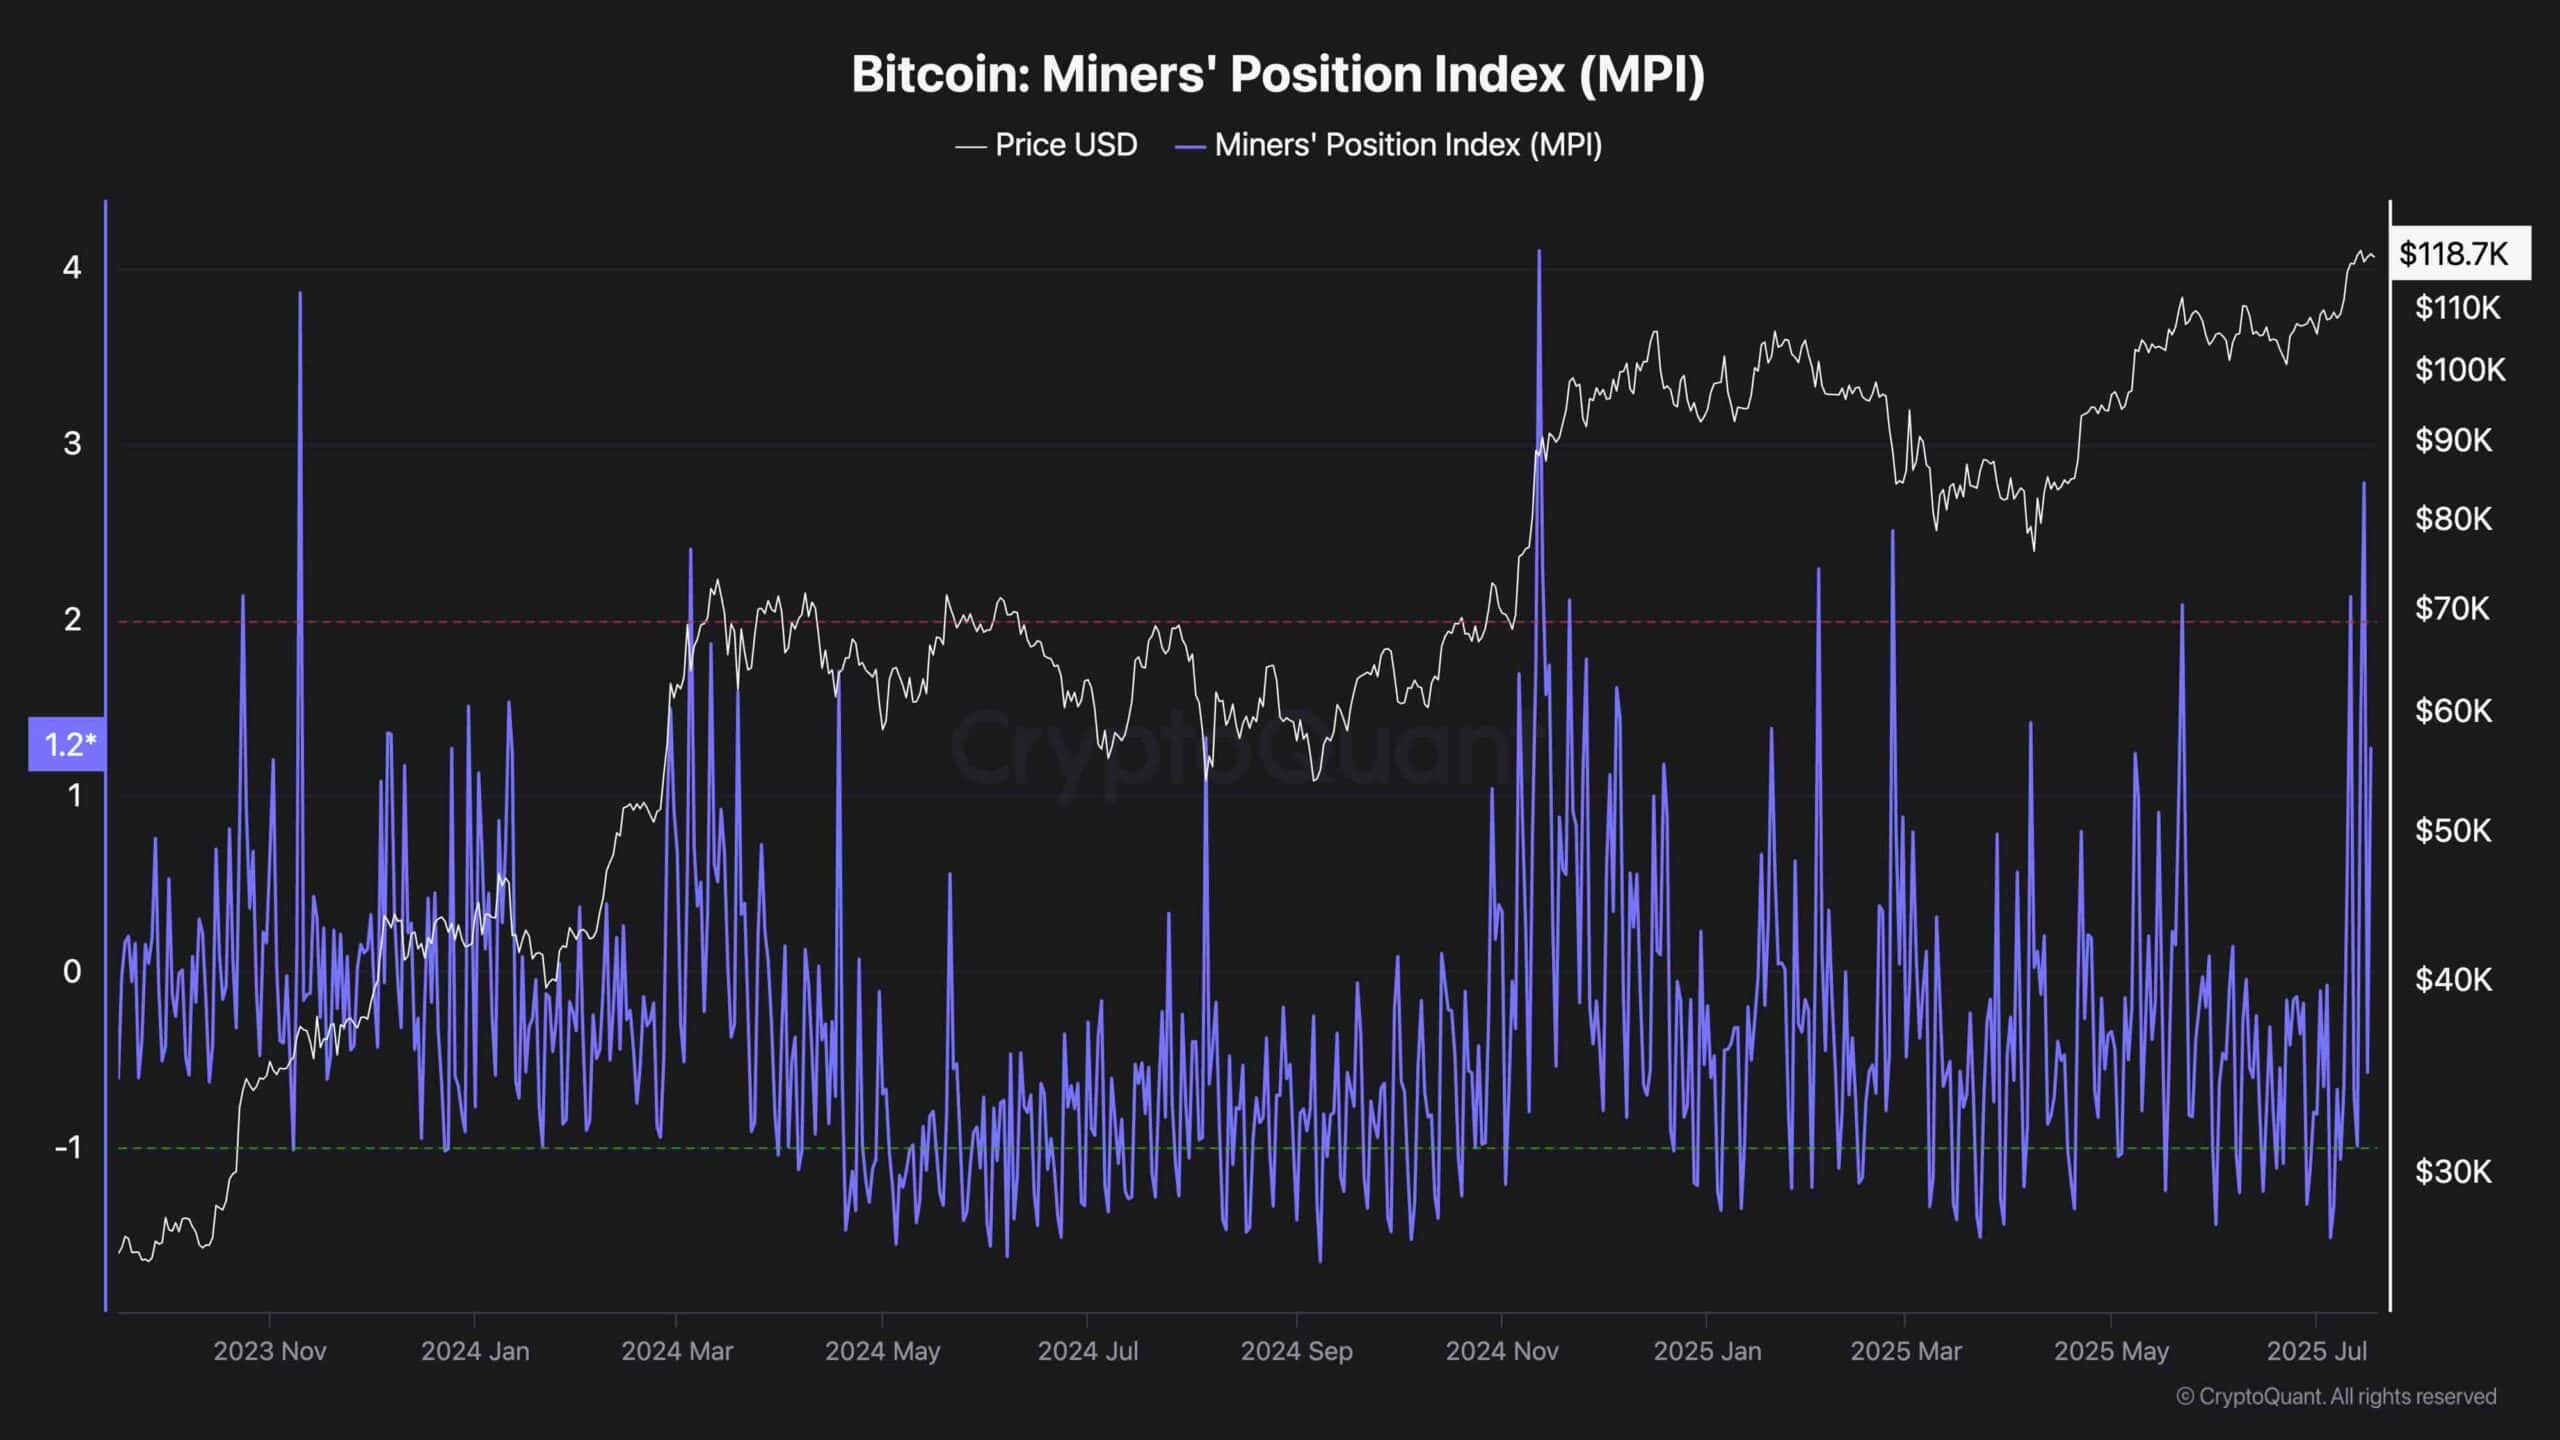
The post Bitcoin Price Analysis: Is Bitcoin Due for a Reset Before Its Next Breakout?? appeared first on CryptoPotato.

Related Articles

dYdX buys its way into social-first perps trading by hiring an entire team at once
Instead of headhunting, dYdX bought the whole company. Pocket Protector’s lean team...

CZ is right: There is a structural gap in Web3 trading
Web3’s current trading infrastructure fails to offer institutional participants privacy, scale and...

BTC and XRP Hit Fresh Milestones as Altcoins Take Off: Your Weekly Crypto Recap
It was a big week in the cryptocurrency world, with the US...

How Jack Dorsey’s new app lets you chat without the internet and why it matters
Unlike traditional messaging apps that rely on internet infrastructure, Bitchat operates on...
Leave a comment