


Bitcoin Price Action Strong – Can Bulls Maintain Momentum?

Bitcoin price is showing positive signs above $114,500. BTC is now consolidating and might rise further if it clears the $116,200 resistance zone.
- Bitcoin started a fresh increase above the $114,200 zone.
- The price is trading below $115,000 and the 100 hourly Simple moving average.
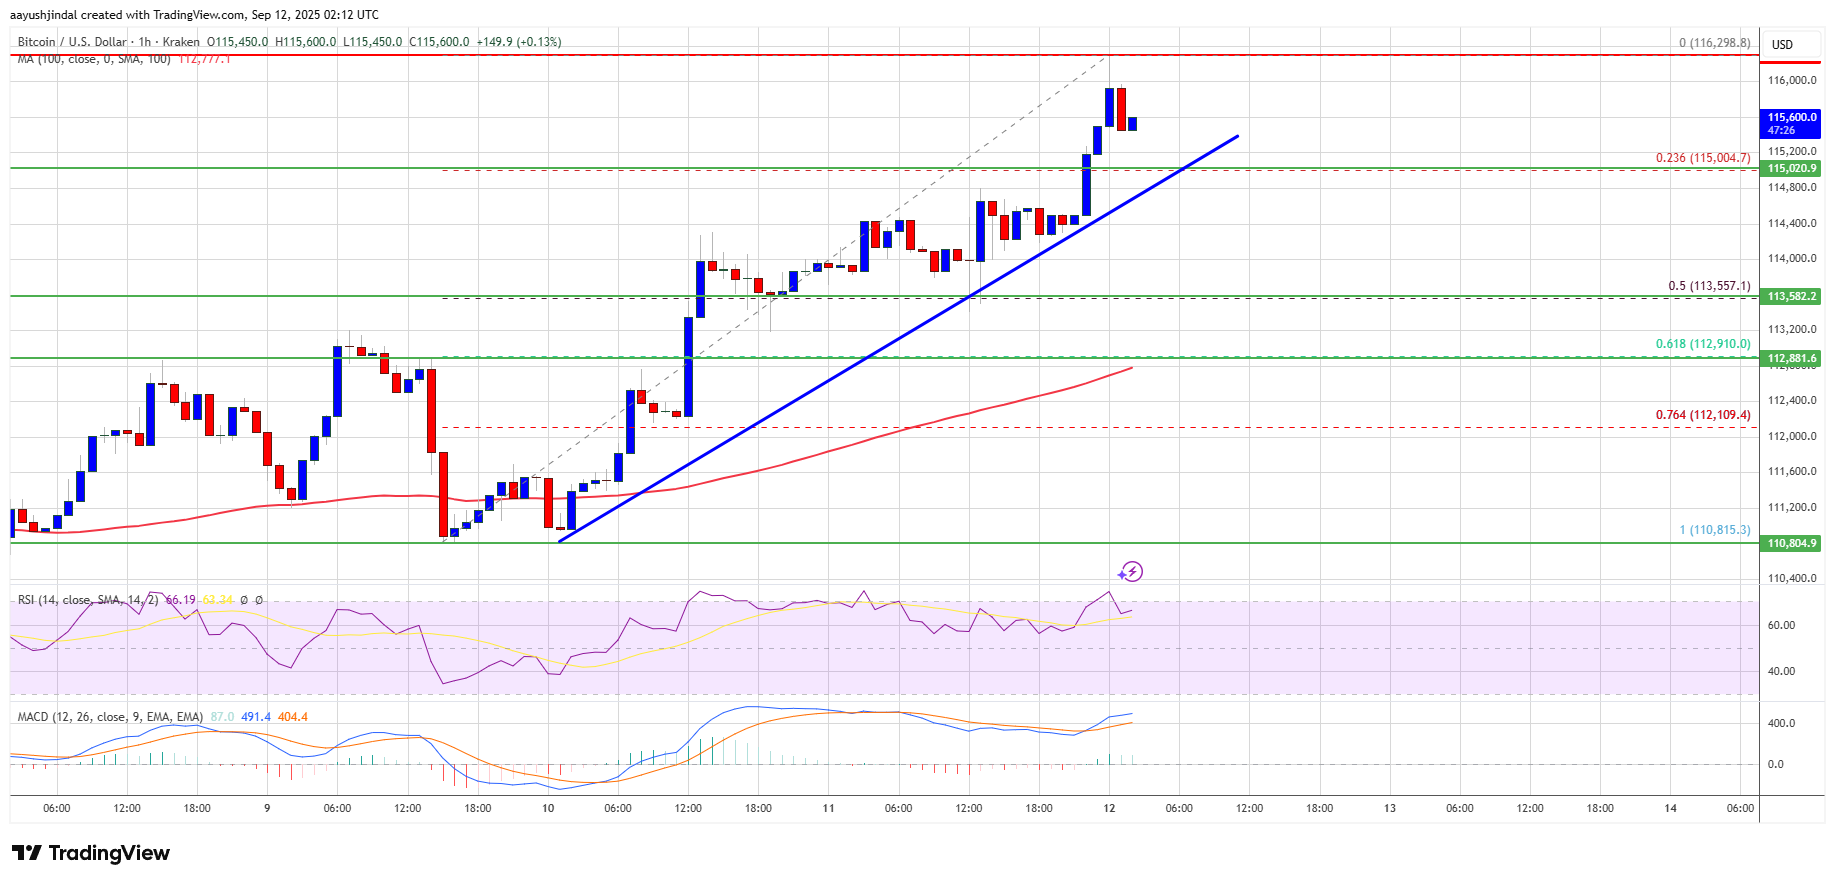
- There is a bullish trend line forming with support at $115,000 on the hourly chart of the BTC/USD pair (data feed from Kraken).
- The pair might start another increase if it clears the $116,200 zone.
Bitcoin Price Gains Traction
Bitcoin price started a fresh recovery wave from the $111,200 zone. BTC managed to climb above the $112,500 and $113,500 resistance levels.
The bulls were able to push the price above $114,000 and $115,000. The price traded as high as $116,298 and recently started a consolidation phase. There was a minor decline below $115,800, but the price is still above the 23.6% Fib retracement level of the recent move from the $110,815 swing low to the $116,298 high.
Bitcoin is now trading above $114,500 and the 100 hourly Simple moving average. Besides, there is a bullish trend line forming with support at $115,000 on the hourly chart of the BTC/USD pair.
Immediate resistance on the upside is near the $116,000 level. The first key resistance is near the $116,200 level. The next resistance could be $116,800. A close above the $116,800 resistance might send the price further higher. In the stated case, the price could rise and test the $117,500 resistance level. Any more gains might send the price toward the $118,400 level. The next barrier for the bulls could be $118,800.
Another Decline In BTC?
If Bitcoin fails to rise above the $116,200 resistance zone, it could start a fresh decline. Immediate support is near the $115,000 level and the trend line zone. The first major support is near the $113,550 level or the 50% Fib retracement level of the recent move from the $110,815 swing low to the $116,298 high.
The next support is now near the $113,000 zone. Any more losses might send the price toward the $112,500 support in the near term. The main support sits at $110,500, below which BTC might decline sharply.
Technical indicators:
Hourly MACD – The MACD is now gaining pace in the bullish zone.
Hourly RSI (Relative Strength Index) – The RSI for BTC/USD is now above the 50 level.
Major Support Levels – $115,000, followed by $113,500.
Major Resistance Levels – $116,000 and $116,200.


Related Articles

RWA tokens surge 11% weekly as onchain value peaks at $29B
The total onchain value of real-world assets has almost doubled since the...

BlackRock plans to tokenize ETFs after Bitcoin ETF boom and BUIDL success
BlackRock is preparing its next big step in digital finance with plans...

Crypto exchange Bitstamp flips Robinhood’s crypto volumes in August
Bitstamp recorded a 21% rise in crypto trading volume to $14.4 billion...

Bitcoin ETF sees $552.7M inflow and Ethereum ETF sees $113.1M inflow on Sept. 11
The significant inflows into Bitcoin and Ethereum ETFs highlight growing investor confidence...
Leave a comment