
Bitcoin Golden Cross Incoming, But Tensions Threaten Breakout

Bitcoin is still trying to regain short-term bullish momentum, as shown by its price action in the past 24 hours. After briefly slipping below $104,500, the cryptocurrency bounced back to trade above $106,000, and technical analysis now shows a technical formation that could cause the start of a more extended rally.
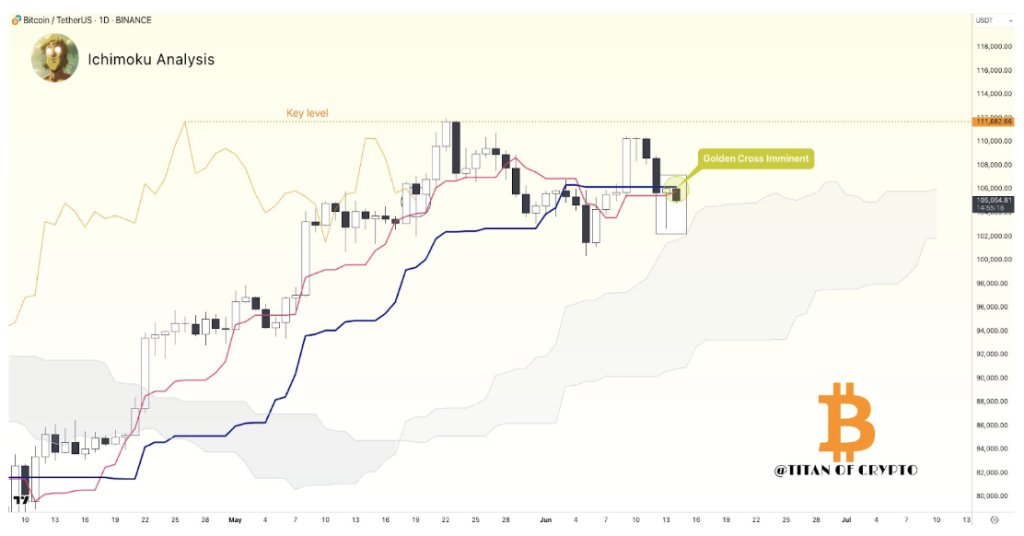
Interestingly, as seen in the daily Ichimoku chart shared by analyst Titan of Crypto, Bitcoin is currently on the verge of confirming a golden cross, which is a bullish signal, within the coming days.
Ichimoku Cloud Builds Case For Bullish Breakout
Taking to the social media platform X, crypto analyst Titan of Crypto highlighted the recent daily price close above the Tenkan line as a strong technical signal for Bitcoin. The Tenkan, also known as the conversion line, is an intriguing indicator for short-term trend strength in Ichimoku analysis. According to the analyst, the current setup on Bitcoin’s daily chart shows the conditions aligning for a golden cross where the shorter-term average overtakes the longer-term one, which is a potential long-term bullish shift. This crossover, if confirmed, would be one of the most reliable trend-reversal patterns in technical trading.
Right now, Bitcoin’s price action is consolidating around $105,000. However, if this golden cross does play out well, Bitcoin could attempt another run toward the key resistance level around $111,600. However, current geopolitical instability, especially the rising tensions in the Middle East, could disrupt this technical picture at any moment and cause a reassessment of the bullish outlook.
Support And Whale Activity Clash With Bullish Setup
Despite the bullish technical backdrop, other market signals are flashing warnings for Bitcoin. Notably, analyst Ali Martinez identified $104,124 as an important support level for Bitcoin. This price point is not just arbitrary, as it represents a heavy concentration of UTXO realized prices.

Many investors bought in at that level, and if Bitcoin falls below it, the next likely destination could be $97,405. The URPD chart confirms that the safety net between $104,000 and $97,000 is somewhat thin. This means that once $104,000 is breached to the downside, a swift and steep correction could follow due to the lack of strong buying interest in that gap.

Further complicating the picture is the behavior of large Bitcoin holders. On-chain data shows that some of the biggest whales, addresses holding over 1,000 BTC, have started reducing their holdings in recent days. This decline in whale wallet count initially began shortly after Bitcoin reached its new all-time high of $111,800 on May 22. The reduction in whale count resumed again after Bitcoin was rejected at the $110,000 region early last week.
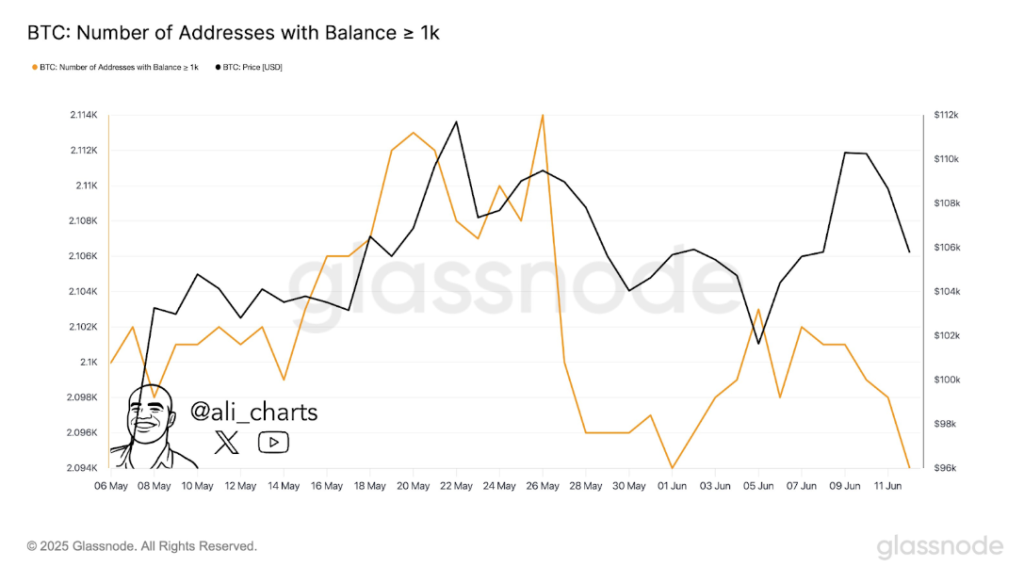
As such, whale addresses holding over 1,000 BTC have fallen from a recent peak of 2,114 to a recent reading of 2,094 addresses. At the time of writing, Bitcoin is trading at $105,505.
Featured image from Unsplash, chart from TradingView

Related Articles

AI race between US and China resembles Cold War — Marc Andreessen
The venture capitalist warned that virtually all artificial intelligence platforms are being...

Binance Assists in Operation RapTor Targeting Darknet Drug Network
Binance revealed that it has played a central role in dismantling Incognito...

Shiba Inu Burn Explodes 3,194%: Can It Change The SHIB Price Trajectory?
Shiba Inu has seen a surge in burn activity, with the burn...

Bitcoin mining difficulty falls slightly from recent all-time high
BTC miners continue to face economic headwinds and challenges, including gradually rising...
Leave a comment