


Bitcoin Extends Decline — Market Remains Under Pressure From Risk-Off Tone

Bitcoin price is correcting gains below $112,500. BTC could continue to move down if it stays below the $112,000 resistance.
- Bitcoin started a downside correction below the $112,000 support.
- The price is trading below $112,000 and the 100 hourly Simple moving average.
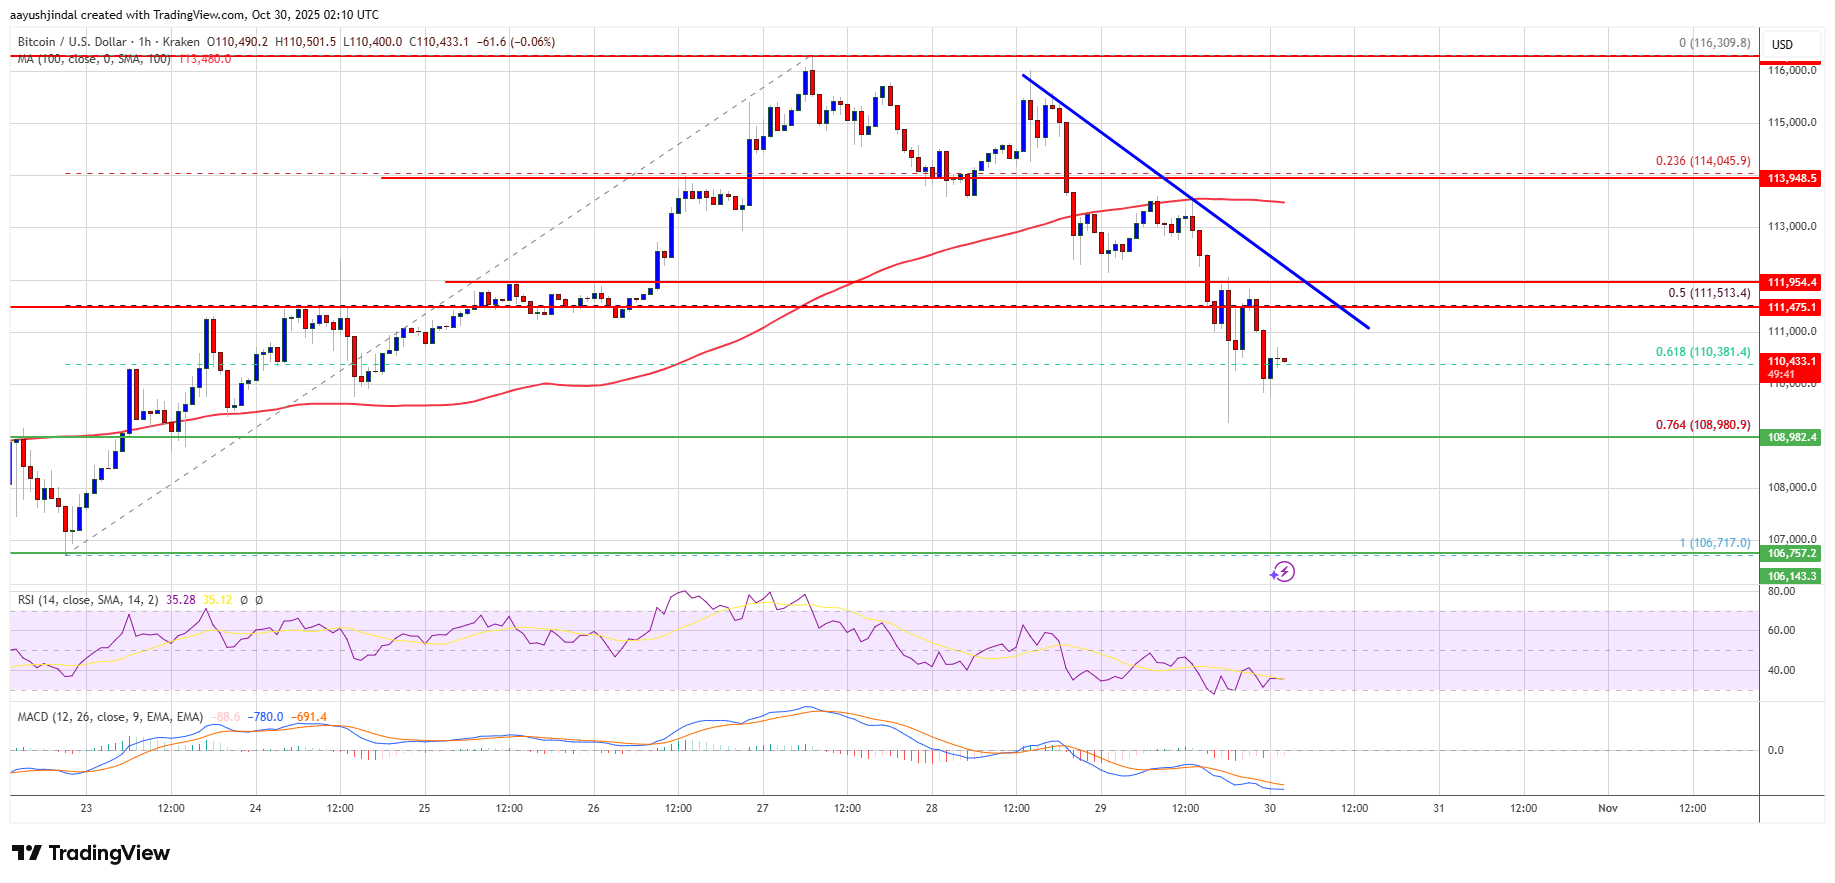
- There is a bearish trend line forming with resistance at $111,500 on the hourly chart of the BTC/USD pair (data feed from Kraken).
- The pair might continue to move down if it trades below the $108,800 zone.
Bitcoin Price Dips Further
Bitcoin price failed to stay above the $113,500 pivot level and extended losses. BTC dipped below $112,500 and $112,000 to enter a bearish zone.
The decline was such that the price traded below the 61.8% Fib retracement level of the upward move from the $106,718 swing low to the $116,310 high. Besides, there is a bearish trend line forming with resistance at $111,500 on the hourly chart of the BTC/USD pair.
Bitcoin is now trading below $112,000 and the 100 hourly Simple moving average. If the bulls attempt a fresh increase, the price could face resistance near the $111,500 level and the trend line. The first key resistance is near the $112,000 level.
The next resistance could be $112,500. A close above the $112,500 resistance might send the price further higher. In the stated case, the price could rise and test the $113,200 resistance. Any more gains might send the price toward the $113,500 level. The next barrier for the bulls could be $115,000 and $115,500.
More Losses In BTC?
If Bitcoin fails to rise above the $112,500 resistance zone, it could continue to move down. Immediate support is near the $110,000 level. The first major support is near the $108,800 level or the 76.4% Fib retracement level of the upward move from the $106,718 swing low to the $116,310 high.
The next support is now near the $108,000 zone. Any more losses might send the price toward the $106,500 support in the near term. The main support sits at $103,500, below which BTC might struggle to recover in the short term.
Technical indicators:
Hourly MACD – The MACD is now gaining pace in the bearish zone.
Hourly RSI (Relative Strength Index) – The RSI for BTC/USD is now below the 50 level.
Major Support Levels – $108,800, followed by $108,000.
Major Resistance Levels – $111,500 and $112,000.

Related Articles

Gold sinks below $4K: What does it mean for Bitcoin price?
Bitcoin ETFs gained $839 million while gold funds lost $4.10 billion, highlighting...

Crypto prices today (Oct. 30): BTC, ETH, XRP, SOL dip as Fed rate cut sparks profit-taking
The crypto market traded lower on Thursday, Oct. 30, with investors taking...

Hong Kong warns retail investors on digital asset treasury risks
Hong Kong regulators have blocked at least five public companies from pivoting...

Solana ETFs live now: Where’s the $200 Solana price breakout?
After the debut of two Solana ETFs on the U.S market, the...
Leave a comment