- Home
- Advertise With us
- World News
- Tech
- Entertainment
- Travels & Tours
- Contact US
- About us
- Privacy Policy
Top Insights
Bitcoin Cycle Top Still Not In, Suggests NVT Golden Cross

On-chain data shows the Bitcoin NVT Golden Cross has still not breached into the territory that marked the tops of previous cycles.
30-Day EMA Of Bitcoin NVT Golden Cross Is Still Below Overheated Zone
As pointed out by an analyst in a CryptoQuant Quicktake post, the Bitcoin NVT Golden Cross is yet to hit an extreme level in the current cycle. The Network Value to Transactions (NVT) Ratio is an on-chain indicator that measures the ratio between BTC’s market cap and transaction volume.
When the value of this metric is high, it means the value of the network (as represented by the market cap) is high compared to its ability to transact coins (the volume). Such a trend can be a sign that the asset may be overvalued. On the other hand, the indicator having a low value can imply the cryptocurrency’s price could have room to grow as its market cap isn’t inflated against its transaction volume.
In the context of the current discussion, a modified form of the NVT Ratio called the NVT Golden Cross is the indicator of interest. This metric is a Bollinger-band-like signaling indicator that compares the short-term trend of the NVT Ratio (10-day moving average) against its long-term trend (30-day MA) to determine whether the indicator is near a top or bottom.
Now, here is a chart that shows the trend in the 30-day exponential moving average (EMA) of the Bitcoin NVT Ratio over the past decade:

As displayed in the above graph, the 30-day EMA Bitcoin NVT Golden Cross currently has a value of around zero, which suggests the market is in a neutral phase according to the NVT Ratio.
In the chart, the quant has highlighted the zones where tops and bottoms have historically tended to occur. It would appear that a highly positive value generally signals some sort of top for BTC, while a negative one can lead to a bottom.
In the current cycle so far, the indicator hasn’t seen any spike into the red zone. Whether this means that this bull market is an exception, or that Bitcoin is yet to reach its top, only remains to be seen.
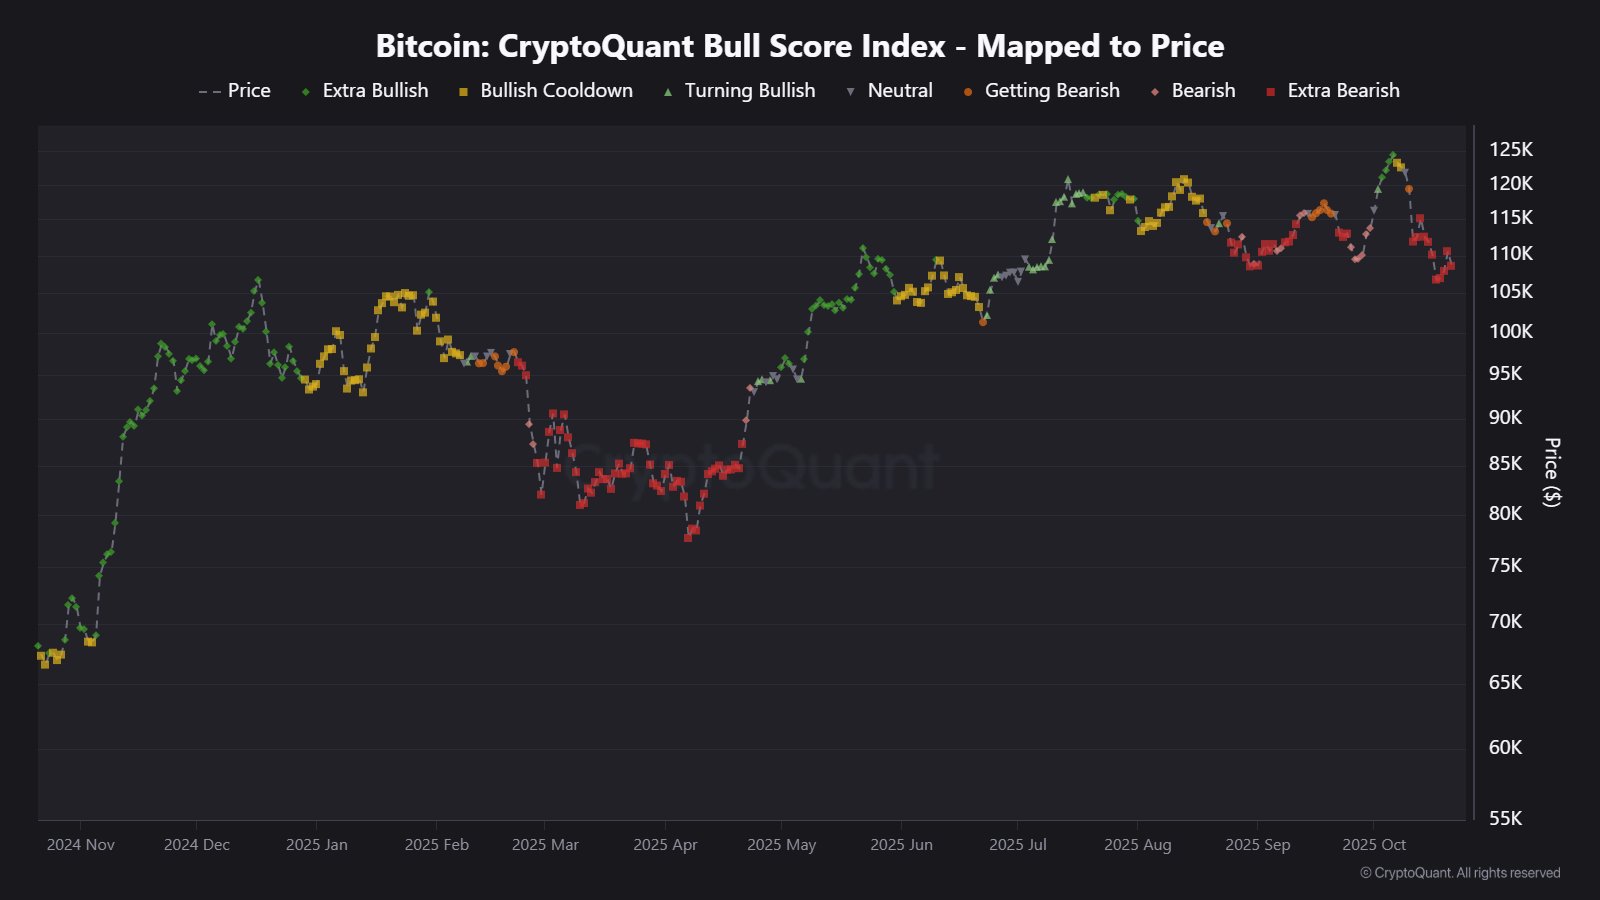
While Bitcoin market conditions are neutral from the perspective of the NVT Golden Cross, CryptoQuant’s Bull Score Index is painting a different picture. As the analytics firm’s community analyst has noted in an X post, this indicator, which combines the data of several key on-chain metrics, is flashing a bear signal for the asset.
BTC Price
Bitcoin surged toward $114,000 on Tuesday, but it would appear that the recovery was only short-lived as the coin is already back at $108,000.
Related Articles
Chris Larsen Cashes Out: $764M In XRP Profits Since 2018
XRP continues to struggle for bullish momentum as market sentiment remains heavily...
HYPE token price jumps 10% after $1B accumulation news and Robinhood listing
The price of the Hyperliquid (HYPE) token rose 10% after Robinhood listing...
Tesla Made $80M in Profit on Bitcoin Holdings in Q3, Didn’t Sell Any Crypto
Bitcoin Magazine Tesla Made $80M in Profit on Bitcoin Holdings in Q3,...
Fidelity opens the door to Solana, making SOL available to clients
The addition of SOL comes amid growing institutional interest in the Solana...


Leave a comment