


Bitcoin Price Trapped Below $70K, Market Awaits Breakout Catalyst

Bitcoin price started a decent increase above $66,000. BTC is now consolidating above $66,000 and might aim for more gains above $67,200.
- Bitcoin started a fresh increase after it settled above the $65,500 support.
- The price is trading below $67,000 and the 100 hourly simple moving average.
- There is a bearish trend line forming with resistance at $67,000 on the hourly chart of the BTC/USD pair (data feed from Kraken).
- The pair might dip again if it trades below the $65,500 and $65,000 levels.
Bitcoin Price Faces Key Resistance
Bitcoin price managed to form a base above the $63,500 zone. BTC started a fresh increase and was able to surpass the $64,500 resistance zone.
The price even rallied above the $67,000 resistance. Finally, the bears appeared near $68,000. A high was formed at $68,180, and the price recently corrected some gains. There was a move below the 50% Fib retracement level of the upward move from the $63,030 swing low to the $68,181 high.
Bitcoin is now trading below $67,000 and the 100 hourly simple moving average. If the price remains stable above $65,000, it could attempt a fresh increase. Immediate resistance is near the $67,000 level. There is also a bearish trend line forming with resistance at $67,000 on the hourly chart of the BTC/USD pair.
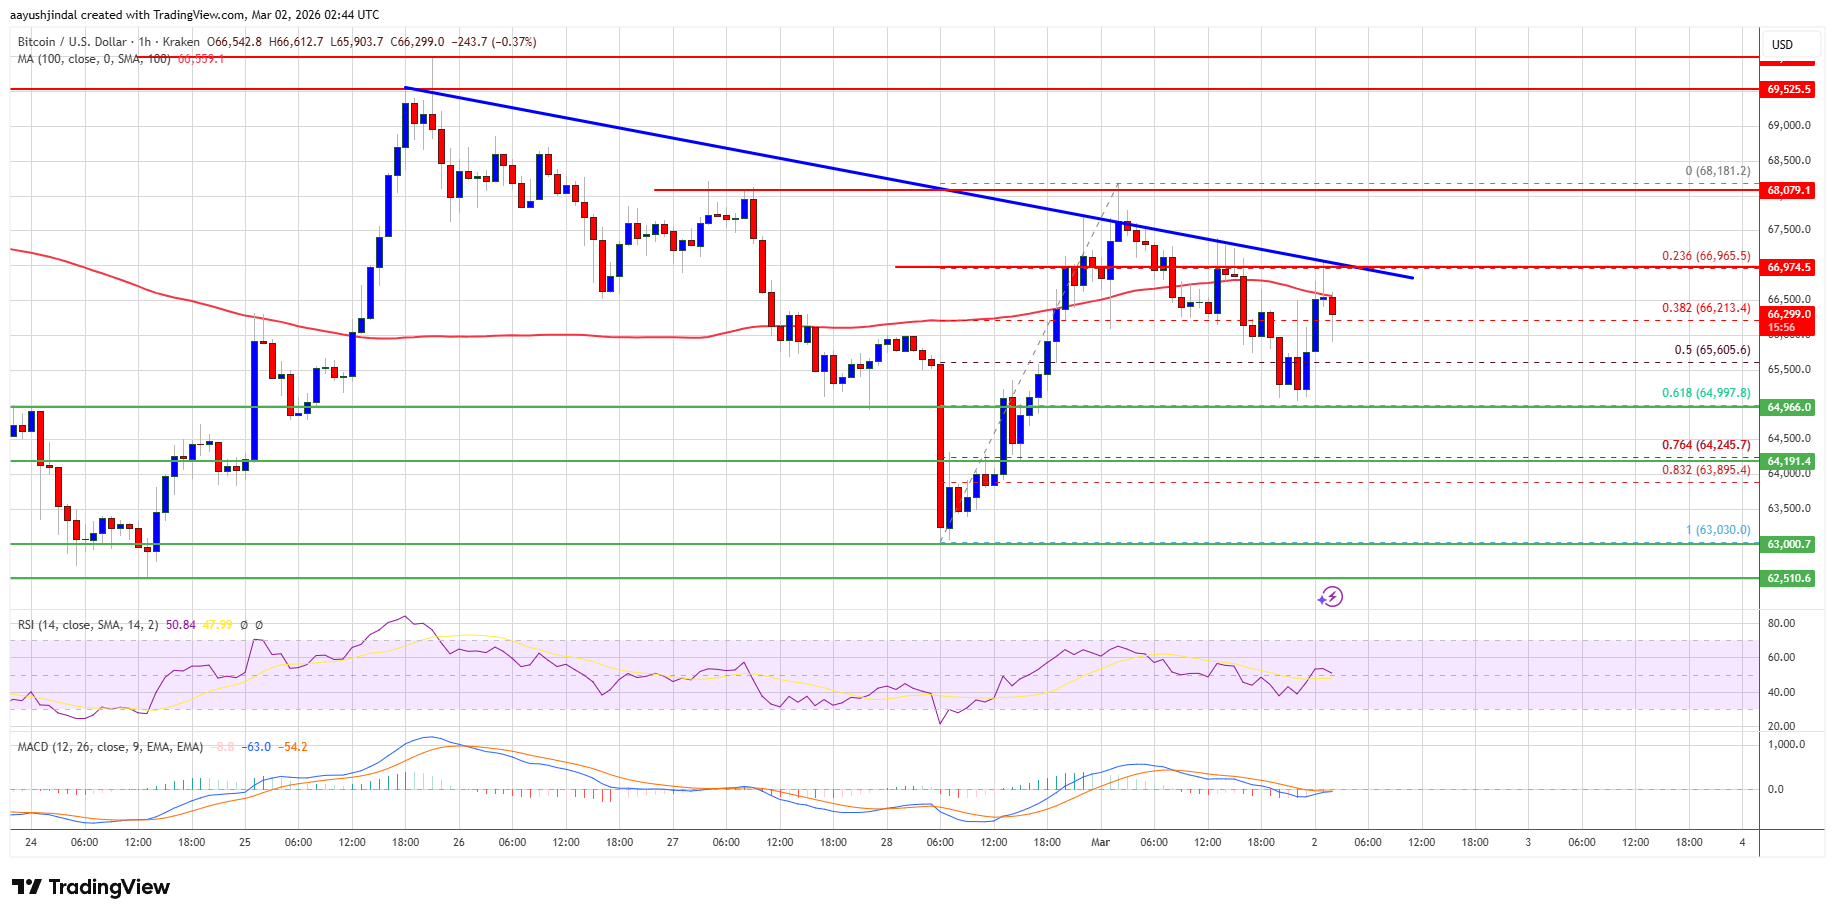
The first key resistance is near the $68,200 level. A close above the $68,200 resistance might send the price further higher. In the stated case, the price could rise and test the $69,500 resistance. Any more gains might send the price toward the $70,000 level. The next barrier for the bulls could be $70,500 and $71,200.
Downside Continuation In BTC?
If Bitcoin fails to rise above the $67,000 resistance zone, it could start another decline. Immediate support is near the $65,500 level. The first major support is near the $65,000 level or the 61.8% Fib retracement level of the upward move from the $63,030 swing low to the $68,181 high.
The next support is now near the $64,250 zone. Any more losses might send the price toward the $64,000 support in the near term. The main support now sits at $63,000, below which BTC might struggle to recover in the near term.
Technical indicators:
Hourly MACD – The MACD is now losing pace in the bullish zone.
Hourly RSI (Relative Strength Index) – The RSI for BTC/USD is now above the 50 level.
Major Support Levels – $65,500, followed by $65,000.
Major Resistance Levels – $67,000 and $68,200.


Related Articles

AI models prefer Bitcoin over fiat as top store of value, research shows
A new study from the Bitcoin Policy Institute finds that leading artificial...

Korea halts trading as key indexes drop 10% on Middle East crisis
South Korea’s Kospi and Kosdaq tripped circuit breakers as the Middle East...

U.S. shifts $23,000 in seized Bitcoin as ‘Villanueva’ wallet empties
A wallet on the Bitcoin blockchain associated with U.S. government seizure funds...

Bitcoin LTH Selling Cools: Is Months-Long Distribution Finally Ending?
On-chain data shows Bitcoin long-term holders (LTHs) have seen their netflow rise...
Leave a comment