

Solana (SOL) Upside Builds, $100 Breakout Hopes Strengthen Across Market

Solana started a fresh increase above the $82 zone. SOL price is now consolidating above $85 and might aim for more gains above the $95 zone.
- SOL price started a fresh upward move above the $82 and $85 levels against the US Dollar.
- The price is now trading above $82 and the 100-hourly simple moving average.
- There was a break above a bearish trend line with resistance at $87 on the hourly chart of the SOL/USD pair (data source from Kraken).
- The pair could extend gains if it clears the $88 resistance zone.
Solana Price Regains Traction
Solana price started a decent increase after it settled above the $82 zone, like Bitcoin and Ethereum. SOL climbed above the $85 level to enter a short-term positive zone.
The price even smashed the $88 resistance. The bulls were able to push the price above $90. A high was formed at $92, and the price is now consolidating gains. There was a minor decline below the 23.6% Fib retracement level of the recent upward move from the $75.64 swing low to the $92.05 high.
Recently, there was a break above a bearish trend line with resistance at $87 on the hourly chart of the SOL/USD pair. Solana is now trading above $85 and the 100-hourly simple moving average.
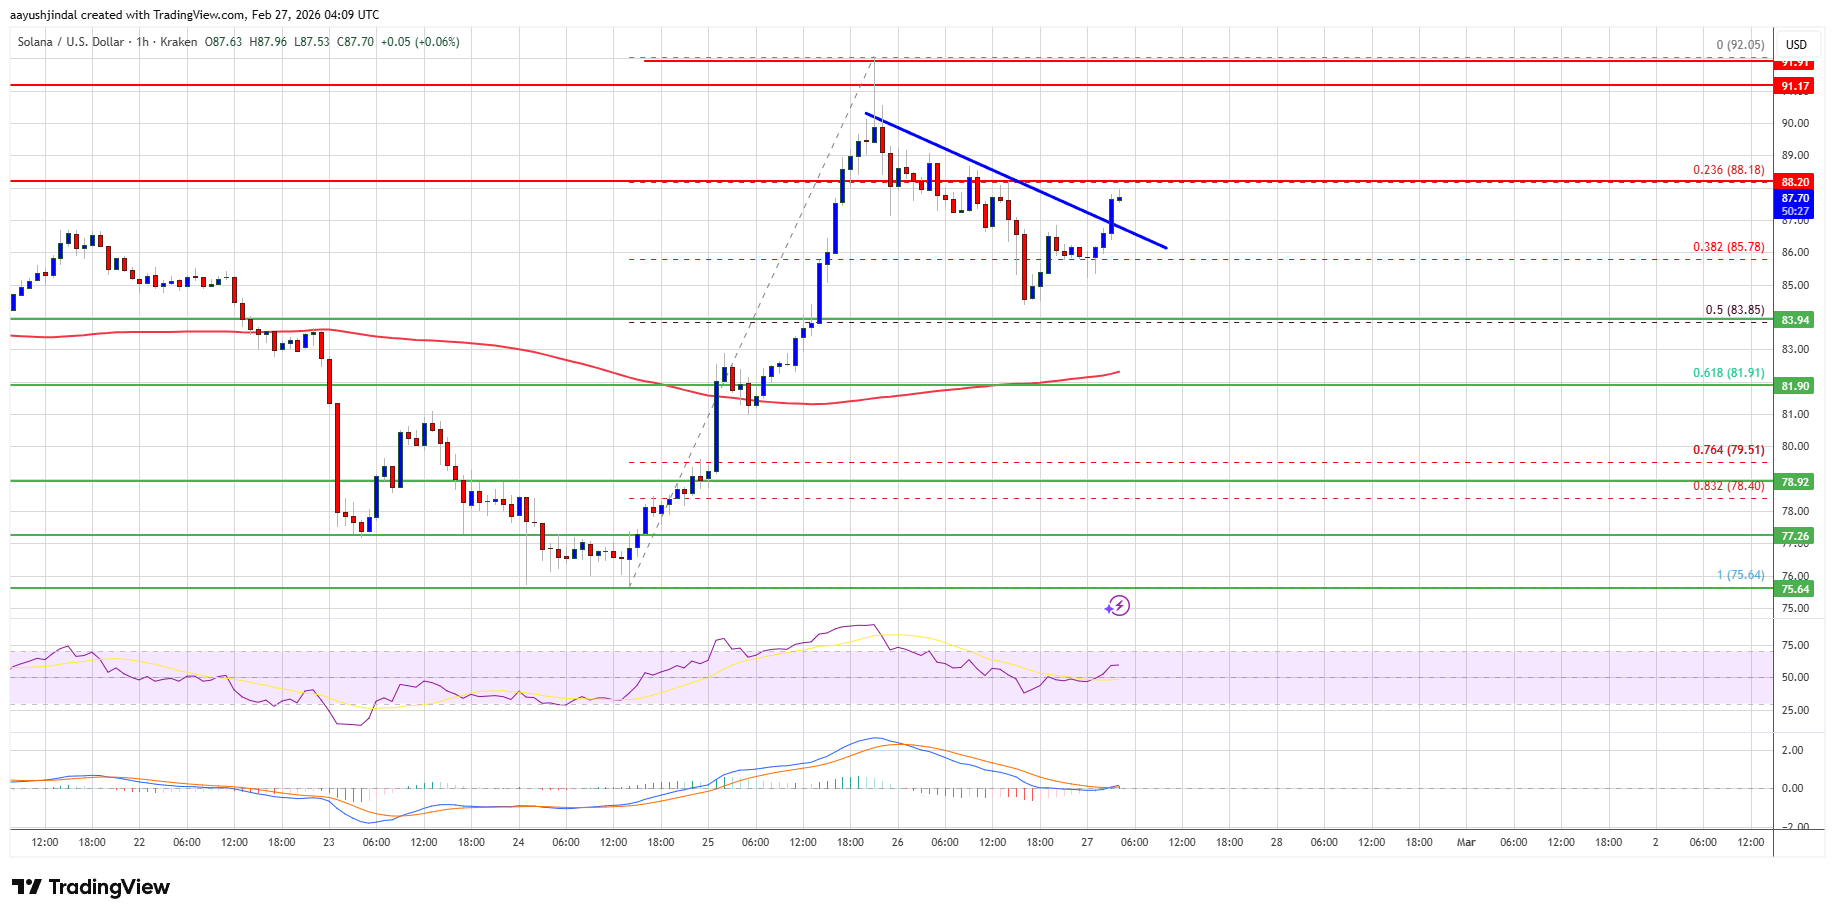
On the upside, the price is facing resistance near $88. The next major resistance is near the $92 level. The main resistance could be $95. A successful close above the $95 resistance zone could set the pace for another steady increase. The next key resistance is $100. Any more gains might send the price toward the $106 level.
Downside Correction In SOL?
If SOL fails to rise above the $88 resistance, it could start another decline. Initial support on the downside is near the $85.50 zone. The first major support is near the $84 level or the 50% Fib retracement level of the recent upward move from the $75.64 swing low to the $92.05 high.
A break below the $84 level might send the price toward the $82 support zone. If there is a close below the $82 support, the price could decline toward the $78 support in the near term.
Technical Indicators
Hourly MACD – The MACD for SOL/USD is gaining pace in the bullish zone.
Hourly Hours RSI (Relative Strength Index) – The RSI for SOL/USD is above the 50 level.
Major Support Levels – $85.50 and $84.00
Major Resistance Levels – $88 and $95.
Related Articles

ADA price forecast: Can Cardano hold its top 10 comeback?
Cardano has made a defiant return to the crypto top 10, reclaiming...

Bitcoin miner MARA posts $1.7B quarterly loss on BTC slump
MARA reported a $1.71 billion quarterly loss as Bitcoin fair‑value markdowns hit...

Trescon marks 10 years building MENA government-backed platforms
Trescon marks 10 years, delivering 500+ government-backed events and scaling from Bengaluru...

Elizabeth Warren grills OCC chief over World Liberty’s bank charter bid
A tense exchange unfolded at a Senate Banking Committee hearing as Senator...
Leave a comment