


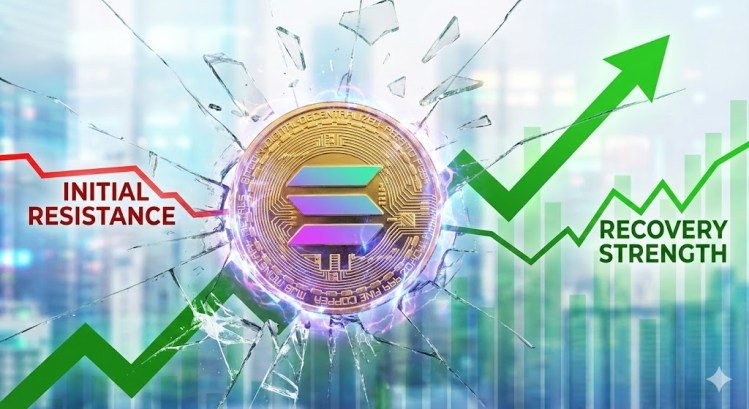
Solana (SOL) Recovery Shows Strength After Breaking Initial Resistance Level
Solana failed to settle above $85 and trimmed some gains. SOL price is now recovering losses from $76 and showing a few positive signs.
- SOL price started a decent recovery wave above $78 and $80 against the US Dollar.
- The price is now trading above $80 and the 100-hourly simple moving average.
- There was a break above a key bearish trend line with resistance at $81 on the hourly chart of the SOL/USD pair (data source from Kraken).
- The price could continue to move up if it clears $82 and $84.
Solana Price Attempts Recovery
Solana price remained stable and started a decent recovery wave above $78, like Bitcoin and Ethereum. SOL was able to climb above the $80 level.
There was a move above the 50% Fib retracement level of the downward move from the $86.68 swing high to the $75.64 low. Besides, there was a break above a key bearish trend line with resistance at $81 on the hourly chart of the SOL/USD pair.
However, the bears are active near $82.50 and the 61.8% Fib retracement level of the downward move from the $86.68 swing high to the $75.64 low. Solana is now trading above $80 and the 100-hourly simple moving average.
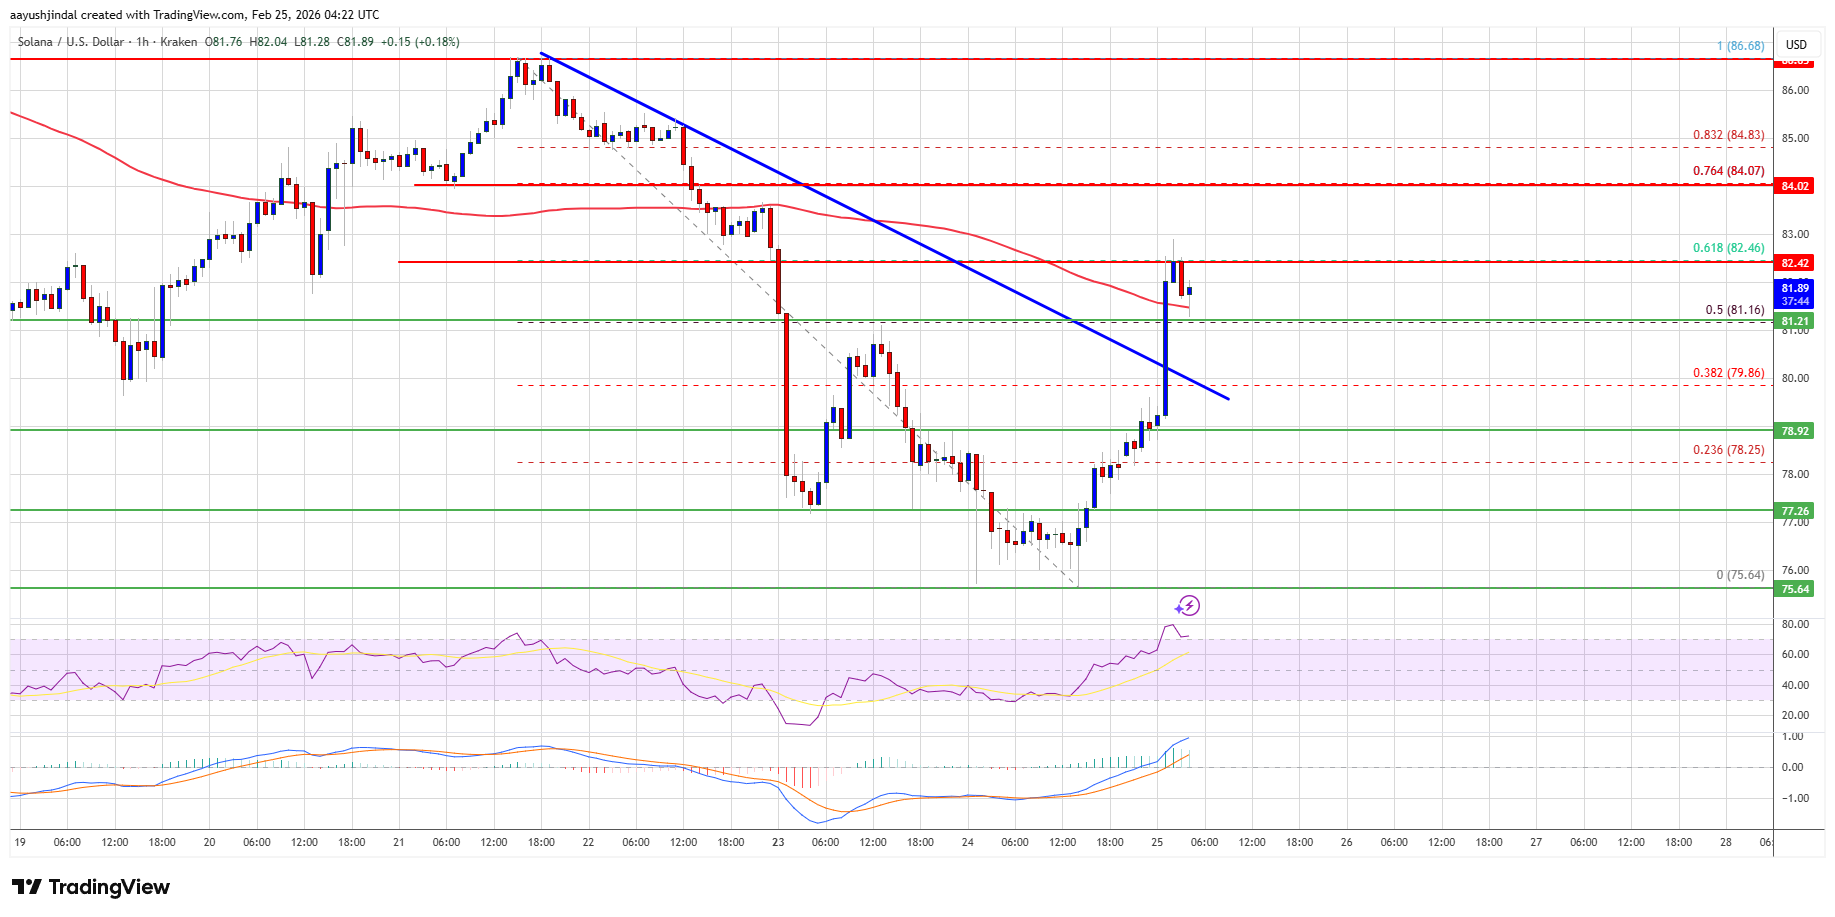
On the upside, immediate resistance is near the $82 level. The next major resistance is near the $84 level. The main resistance could be $85. A successful close above the $85 resistance zone could set the pace for another steady increase. The next key resistance is $92. Any more gains might send the price toward the $95 level.
Another Decline In SOL?
If SOL fails to rise above the $82 resistance, it could continue to move down. Initial support on the downside is near the $80 zone. The first major support is near the $79 level.
A break below the $79 level might send the price toward the $77 support zone. If there is a close below the $77 support, the price could decline toward the $74 zone in the near term.
Technical Indicators
Hourly MACD – The MACD for SOL/USD is gaining pace in the bullish zone.
Hourly Hours RSI (Relative Strength Index) – The RSI for SOL/USD is above the 50 level.
Major Support Levels – $80 and $77.
Major Resistance Levels – $82 and $85.


Related Articles
US seizes $61M in USDT linked to ‘pig butchering’ crypto fraud scheme
The $61 million USDT seizure in North Carolina shows how US authorities...

Coinbase CEO Brian Armstrong pushes back on UK stablecoin caps
Coinbase CEO Brian Armstrong has warned that proposed stablecoin rules in the...
Bitcoin ETFs post $258M inflows as institutional Q4 selling hits 25,000 BTC
US spot Bitcoin ETF flows turned green on Tuesday, with Fidelity and...

Hong Kong expands crypto licensing, stablecoin regime in 2026-27 budget
Hong Kong will introduce sweeping reforms to strengthen its position as a...
Leave a comment