

Ethereum Price Near Technical Flashpoint With Big Move Brewing

Ethereum price found support near $1,928 and recovered some losses. ETH is now consolidating and faces key hurdles near $2,020.
- Ethereum is attempting a fresh recovery wave above $1,950.
- The price is trading below $2,020 and the 100-hourly Simple Moving Average.
- There is a bullish trend line forming with support at $1,950 on the hourly chart of ETH/USD (data feed via Kraken).
- The pair could start a fresh decline if it stays below the $2,020 zone.
Ethereum Price Faces Resistance
Ethereum price failed to stay above $2,000 and started a fresh decline, like Bitcoin. ETH price traded below the $1,950 and $1,940 levels to enter a bearish zone.
Finally, the bulls appeared near $1,925. A low was formed at $1,928, and the price started a recovery wave. There was a move above the $1,950 resistance. The price even spiked above the 38.2% Fib retracement level of the downward move from the $2,101 swing high to the $1,928 low.
Ethereum price is now trading below $2,020 and the 100-hourly Simple Moving Average. If the bulls remain in action above $1,950, the price could attempt another increase. Immediate resistance is seen near the $2,020 level or the 50% Fib retracement level of the downward move from the $2,101 swing high to the $1,928 low.
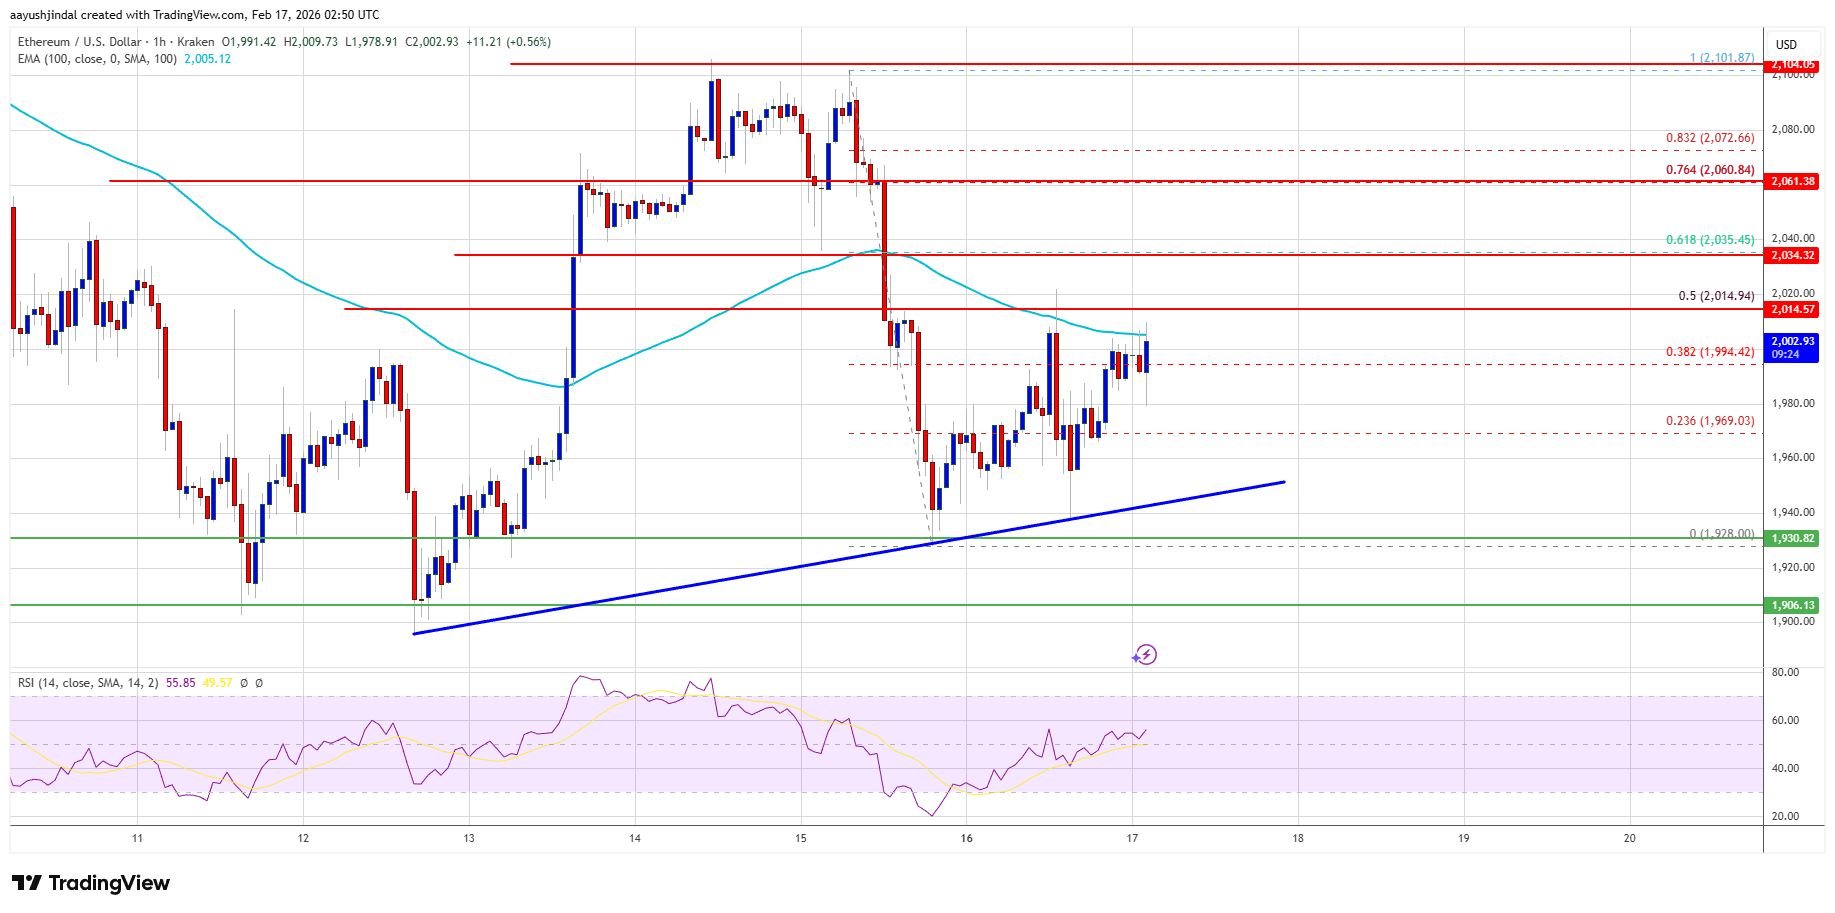
The first key resistance is near the $2,035 level. The next major resistance is near the $2,060 level. A clear move above the $2,060 resistance might send the price toward the $2,120 resistance. An upside break above the $2,120 region might call for more gains in the coming days. In the stated case, Ether could rise toward the $2,150 resistance zone or even $2,185 in the near term.
Another Decline In ETH?
If Ethereum fails to clear the $2,020 resistance, it could start a fresh decline. Initial support on the downside is near the $1,970 level. The first major support sits near the $1,940 zone or the trend line.
A clear move below the $1,940 support might push the price toward the $1,880 support. Any more losses might send the price toward the $1,820 region. The main support could be $1,780.
Technical Indicators
Hourly MACD – The MACD for ETH/USD is gaining momentum in the bullish zone.
Hourly RSI – The RSI for ETH/USD is now above the 50 zone.
Major Support Level – $1,940
Major Resistance Level – $2,020


Related Articles

Crypto Funds Bleed $173M As Outflows Extend To Fourth Week – Report
Crypto exchange-traded products (ETPs) have extended their negative streak to a fourth...

Stablecoins gain ground for paychecks and daily spending: BVNK report
A global survey of 4,658 crypto users found 39% receive income in...

Polygon daily fees flip Ethereum amid prediction market boom
Polygon briefly surpassed Ethereum in daily fees as Polymarket activity surged, highlighting...

Vitalik Buterin: “Ethereum Is Neutral — I’m Not”
Vitalik Buterin has reignited debate about decentralization, neutrality, and free expression within...
Leave a comment