


Bitcoin Price Bleeds Lower With $65K Becoming The Battleground

Bitcoin price failed to stay above $70,000 and started another decline. BTC is now trading below $68,800 and might extend losses in the near term.
- Bitcoin is slowly moving lower below $68,800 and $68,000.
- The price is trading below $68,000 and the 100 hourly simple moving average.
- There is a bearish trend line forming with resistance at $68,200 on the hourly chart of the BTC/USD pair (data feed from Kraken).
- The pair might dip again if it trades below the $66,500 and $65,000 levels.
Bitcoin Price Dips Again
Bitcoin price failed to remain stable above the $70,000 zone. BTC started a fresh decline and traded below the $68,800 support zone. There was a push below $68,000.
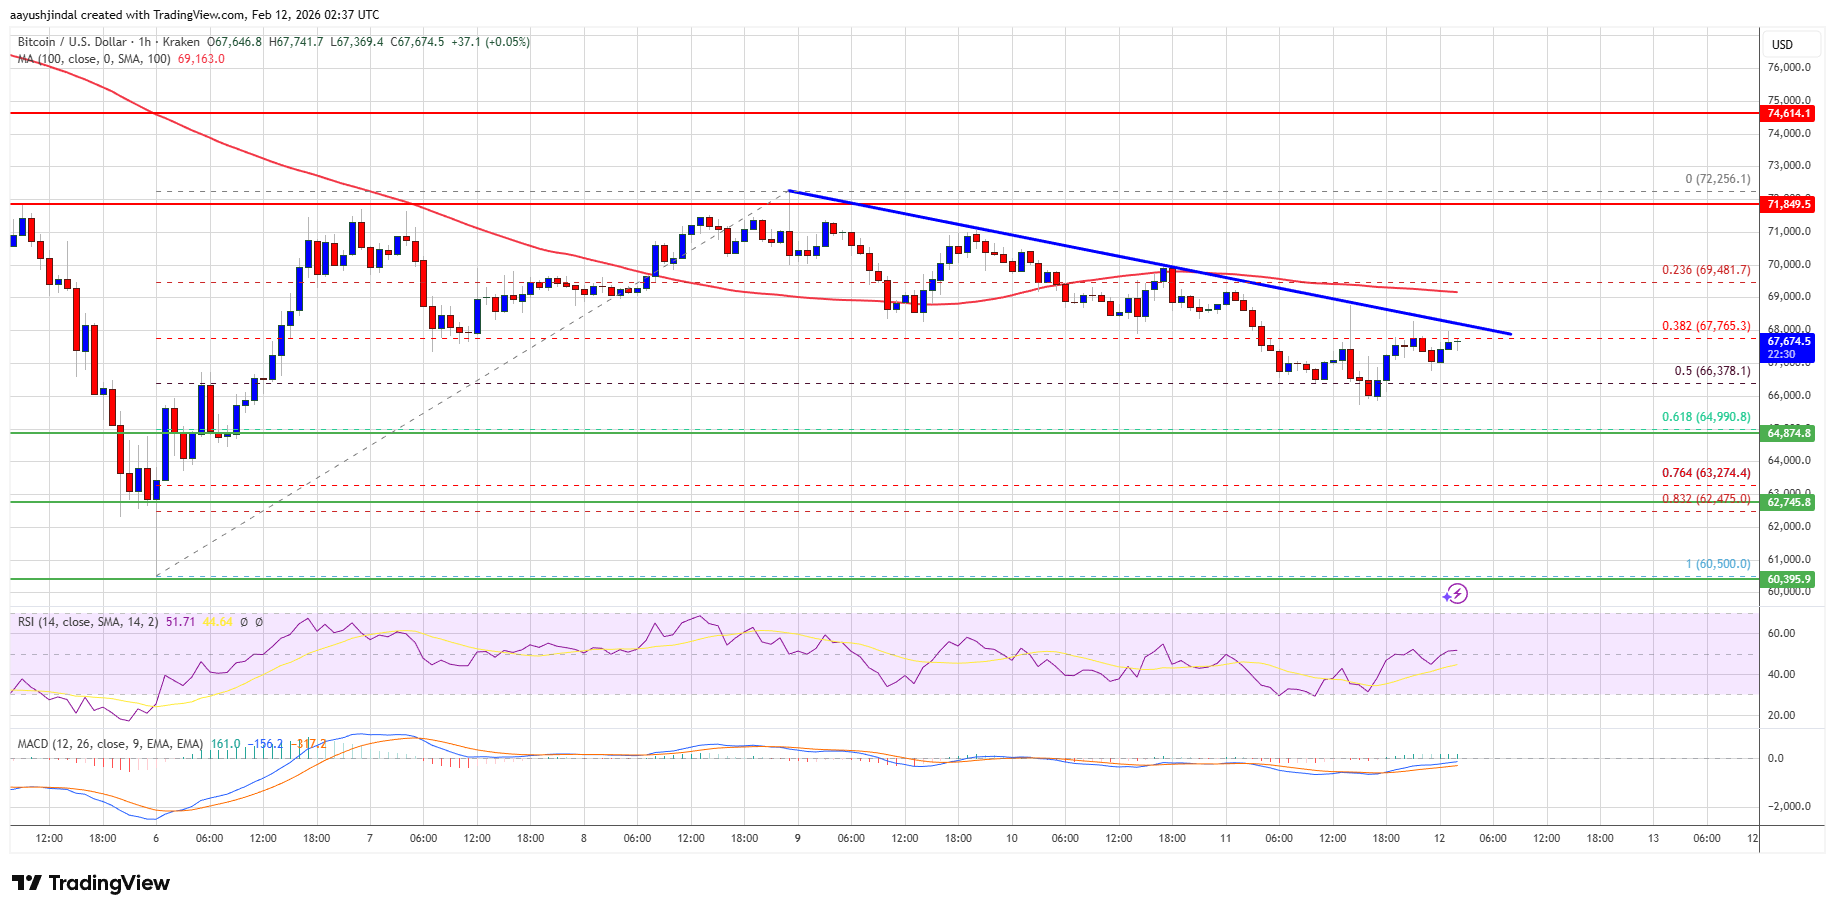
The price dipped below the 50% Fib retracement level of the upward move from the $60,500 swing low to the $72,256 high. There is also a bearish trend line forming with resistance at $68,200 on the hourly chart of the BTC/USD pair.
Bitcoin is now trading below $68,000 and the 100 hourly simple moving average. If the price remains stable above $65,000, it could attempt a fresh increase. Immediate resistance is near the $68,200 level and the trend line.
The first key resistance is near the $69,000 level. A close above the $69,000 resistance might send the price further higher. In the stated case, the price could rise and test the $70,000 resistance. Any more gains might send the price toward the $71,500 level. The next barrier for the bulls could be $72,000 and $72,500.
More Losses In BTC?
If Bitcoin fails to rise above the $69,000 resistance zone, it could start another decline. Immediate support is near the $66,000 level. The first major support is near the $65,000 level or the 61.8% Fib retracement level of the upward move from the $60,500 swing low to the $72,256 high.
The next support is now near the $63,500 zone. Any more losses might send the price toward the $62,000 support in the near term. The main support now sits at $61,200, below which BTC might struggle to recover in the near term.
Technical indicators:
Hourly MACD – The MACD is now gaining pace in the bearish zone.
Hourly RSI (Relative Strength Index) – The RSI for BTC/USD is now below the 50 level.
Major Support Levels – $66,000, followed by $65,000.
Major Resistance Levels – $69,000 and $70,000.

Related Articles

Aster to launch layer 1 mainnet in March with privacy-first features
Aster’s mainnet launch could significantly enhance decentralized finance by prioritizing privacy and...

XRP Slips 4% Amid Policy Uncertainty, but Analysts Say a Major Move Is Brewing
XRP’s price has drifted lower this week, slipping roughly 4.5% and trading...

Ether set for another ‘V-shaped recovery,’ Tom Lee says
Fundstrat’s Tom Lee argues Ether is close to the bottom and says...

Russia is blocking WhatsApp to push ‘surveillance’ app, company says
Russian news outlets reported on Wednesday that WhatsApp’s domain had been completely...
Leave a comment