


Solana (SOL) Under Pressure As Downtrend Looks Ready To Resume
Solana failed to settle above $90 and trimmed some gains. SOL price is now facing hurdles near $88 and might decline again below $82.
- SOL price started a decent recovery wave above $78 and $82 against the US Dollar.
- The price is now trading below $85 and the 100-hourly simple moving average.
- There is a key bearish trend line forming with resistance at $85 on the hourly chart of the SOL/USD pair (data source from Kraken).
- The price could continue to move up if it clears $85 and $90.
Solana Price Faces Resistance
Solana price remained stable and started a decent recovery wave above $72, like Bitcoin and Ethereum. SOL was able to climb above the $80 level.
There was a move above the 50% Fib retracement level of the downward move from the $106 swing high to the $68 low. However, the bears are active near $90. The price is now moving lower below $88. There is also a key bearish trend line forming with resistance at $85 on the hourly chart of the SOL/USD pair.
Solana is now trading below $85 and the 100-hourly simple moving average. On the upside, immediate resistance is near the $85 level and the trend line. The next major resistance is near the $92 level and the 61.8% Fib retracement level of the downward move from the $106 swing high to the $68 low.
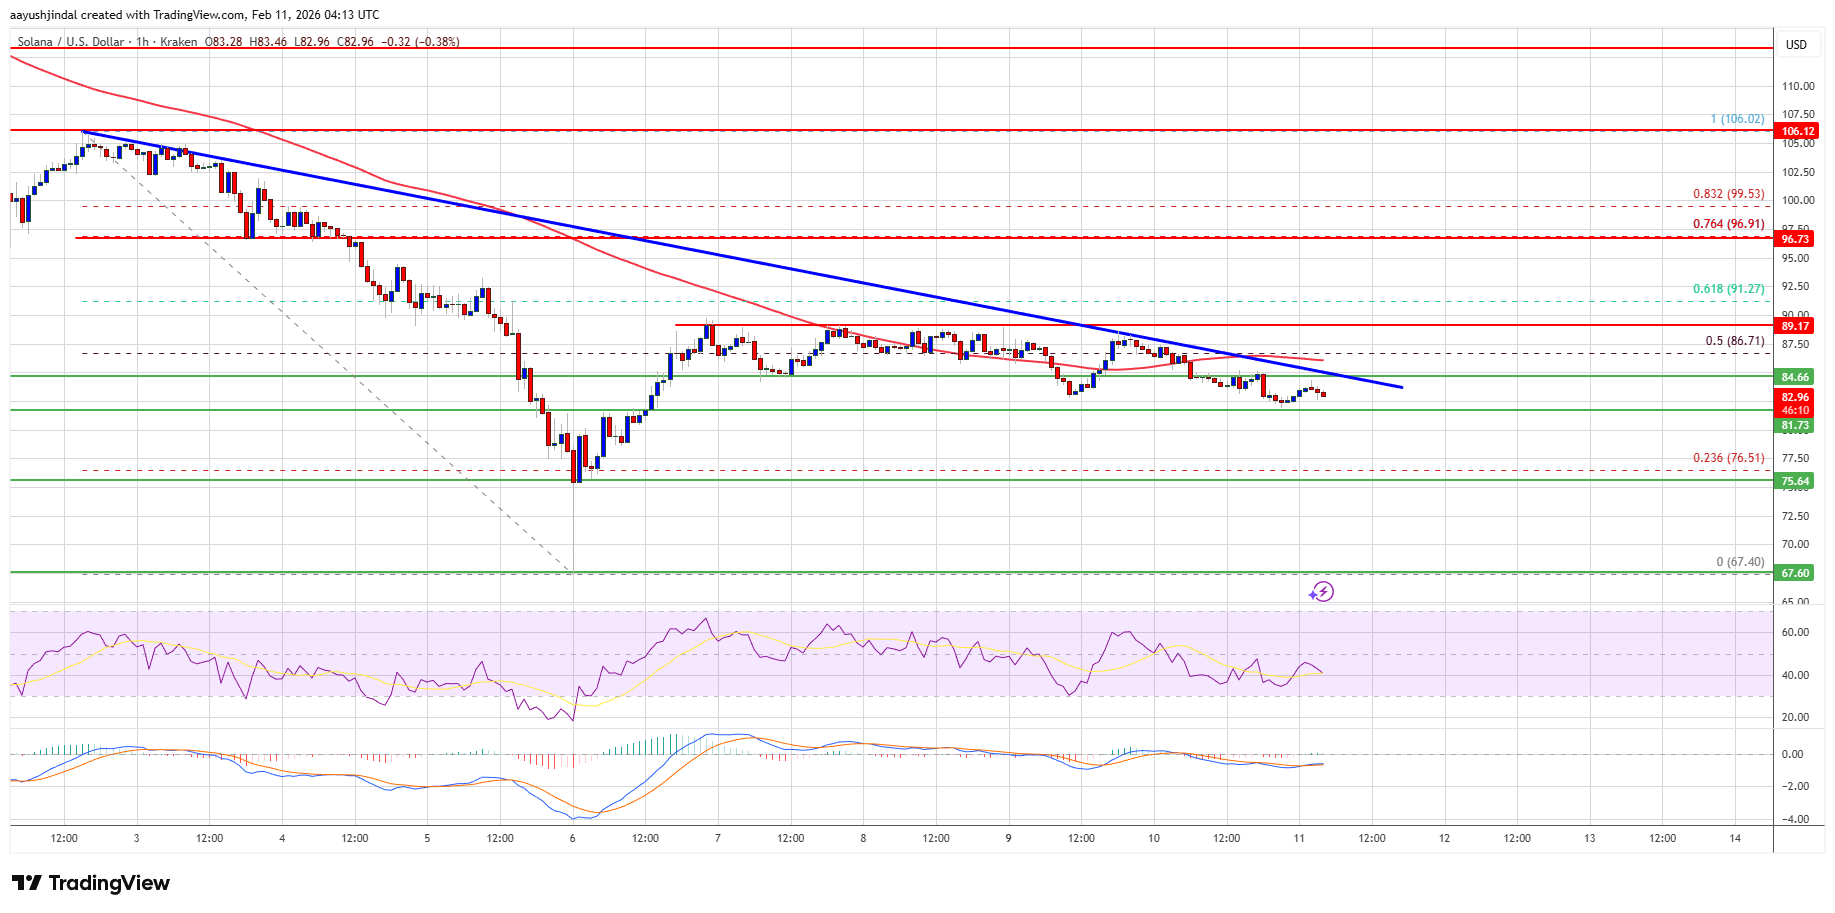
The main resistance could be $96. A successful close above the $96 resistance zone could set the pace for another steady increase. The next key resistance is $105. Any more gains might send the price toward the $112 level.
Downside Continuation In SOL?
If SOL fails to rise above the $85 resistance, it could continue to move down. Initial support on the downside is near the $82 zone. The first major support is near the $80 level.
A break below the $80 level might send the price toward the $75 support zone. If there is a close below the $75 support, the price could decline toward the $70 zone in the near term.
Technical Indicators
Hourly MACD – The MACD for SOL/USD is gaining pace in the bearish zone.
Hourly Hours RSI (Relative Strength Index) – The RSI for SOL/USD is below the 50 level.
Major Support Levels – $82 and $75.
Major Resistance Levels – $85 and $92.
Related Articles
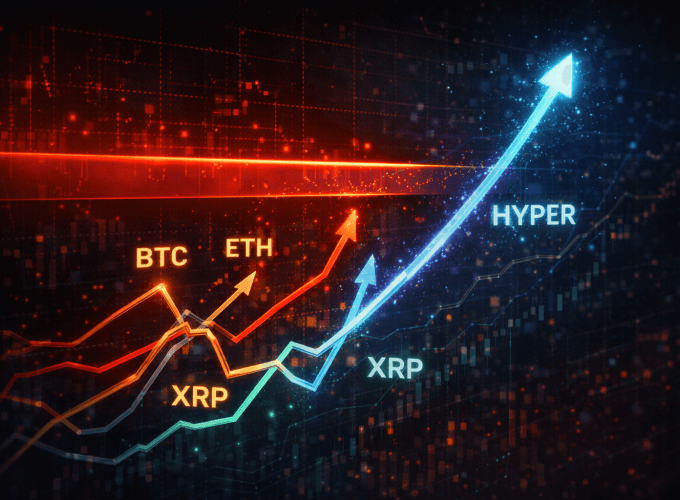
Bitcoin, Ethereum, and Ripple Stall at Key Resistance as a Hyper Captures Market Focus
What to Know: Major cryptocurrencies like Bitcoin, Ethereum, and XRP are facing...

SUBBD Token’s AI Ambition: A Potential Revolution for the $191B Creator Economy?
What to Know: The creator economy is plagued by challenges from centralized...

Spark’s new lending suite tests institutional appetite for onchain stablecoins
Spark is rolling out Spark Prime and Spark Institutional Lending, aiming to...

As Meme Coin Dynasties Shift, Could Maxi Doge Become the New King in 2026?
What to Know: The meme coin market is evolving, rewarding projects with...
Leave a comment