XRP Price Rebound Faces Wall – Key Technicals Suggest Limited Upside Ahead

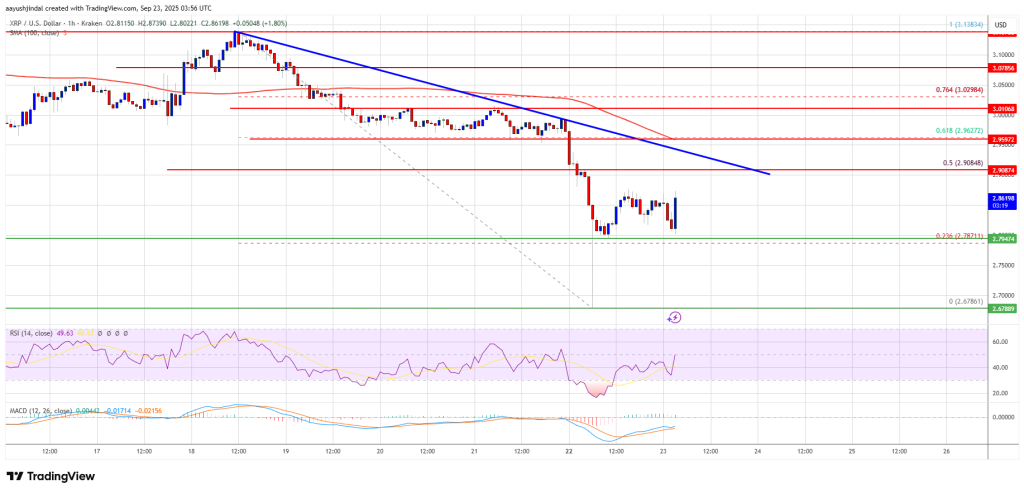
XRP price started a fresh decline below the $2.920 zone. The price is now showing bearish signs and might decline again below the $2.80 zone.
- XRP price is moving lower below the $2.920 support zone.
- The price is now trading below $2.90 and the 100-hourly Simple Moving Average.
- There is a bearish trend line forming with resistance at $2.920 on the hourly chart of the XRP/USD pair (data source from Kraken).
- The pair could continue to move down if it dips below $2.80.
XRP Price Declines Sharply
XRP price failed to extend gains above $3.120 and started a fresh decline, like Bitcoin and Ethereum. The price dipped below the $3.00 and $2.920 support levels.
The bears even pushed the price below $2.80. A low was formed near the $2.678 support, and the price is now correcting some losses. There was a move above the 23.6% Fib retracement level of the recent decline from the $3.138 swing high to the $2.678 low.
The price is now trading below $2.90 and the 100-hourly Simple Moving Average. Besides, there is a bearish trend line forming with resistance at $2.920 on the hourly chart of the XRP/USD pair. If the bulls protect the $2.80 support, the price could attempt a steady recovery.
On the upside, the price might face resistance near the $2.90 level. The first major resistance is near the $2.920 level and the trend line. It is close to the 50% Fib retracement level of the recent decline from the $3.138 swing high to the $2.678 low.
A clear move above the $2.920 resistance might send the price toward the $3.00 resistance. Any more gains might send the price toward the $3.050 resistance. The next major hurdle for the bulls might be near $3.120.
Another Decline?
If XRP fails to clear the $2.920 resistance zone, it could continue to move down. Initial support on the downside is near the $2.820 level. The next major support is near the $2.80 level.
If there is a downside break and a close below the $2.80 level, the price might continue to decline toward $2.740. The next major support sits near the $2.650 zone, below which the price could gain bearish momentum.
Technical Indicators
Hourly MACD – The MACD for XRP/USD is now losing pace in the bearish zone.
Hourly RSI (Relative Strength Index) – The RSI for XRP/USD is now below the 50 level.
Major Support Levels – $2.820 and $2.80.
Major Resistance Levels – $2.90 and $2.920.
Related Articles
Massive XRP Price Move Incoming: Watch This Pattern Play Out for Ripple
TL;DR: XRP forms ABCDE correction end, with $2.65 support holding and $3.333...
DeFi Development Corp. announces $100M share repurchase authorization
DeFi Development Corp.’s share buyback could boost investor confidence and signal strong...
The Real Reason The Bitcoin Price Can’t Go Higher
Bitcoin Magazine The Real Reason The Bitcoin Price Can’t Go Higher The...
Bitwise CIO says institutions mull adding Bitcoin to portfolios
Institutional interest in Bitcoin could drive mainstream adoption, influence market dynamics, and...


Leave a comment