


Is This the Calm Before XLM’s Jump to $0.50?

TL;DR
- XLM holds firm at $0.35, setting up for a potential triangle breakout to $0.50.
- MACD and RSI show weakening momentum, with bears still controlling the daily trend.
- Open interest on XLM futures has decreased after a sharp spike last month.
XLM Holds Near Key $0.35 Level
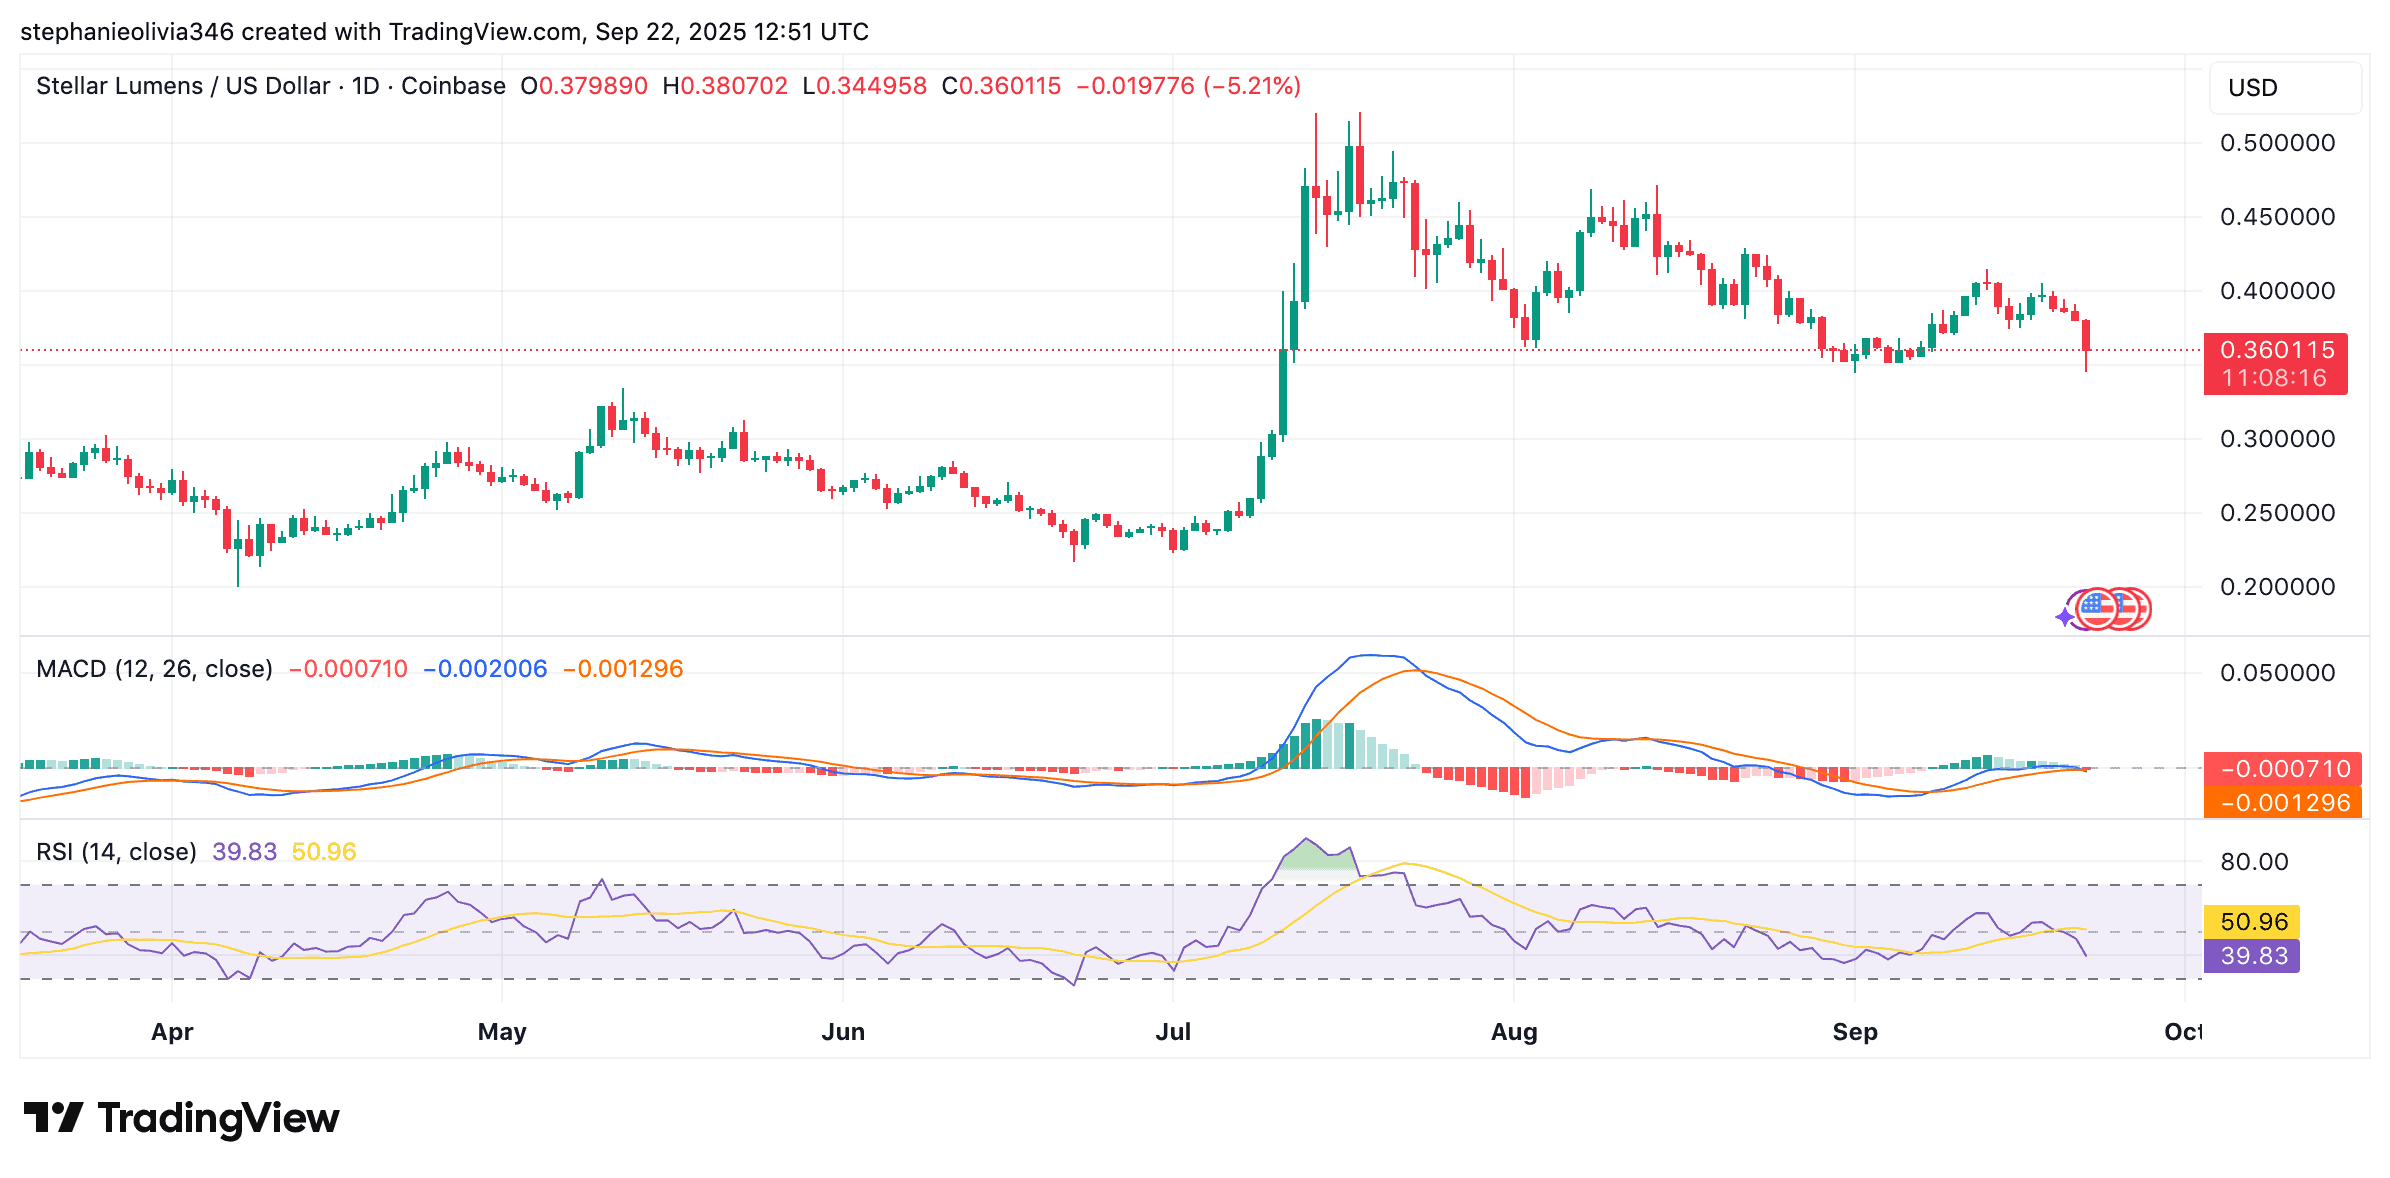
Stellar (XLM) is trading at $0.36 after falling 7% in the past 24 hours. Over the last week, the asset has declined by 5%. The current price sits just above a key support zone at $0.35, a level that has previously shown strong buying interest.
According to crypto analyst Ali Martinez, the recent dip was not unexpected. He stated,
“Stellar $XLM dipped to $0.35 as expected. If this level holds, consolidation toward the triangle’s apex could set up a breakout to $0.50.”
The $0.35 area remains an important zone for traders watching for a shift in trend.
Notably, the 12-hour chart shows a descending triangle formation, which has been developing over the last several weeks. XLM is now near the lower support boundary of this pattern. The price has respected this range before, making the current level a key point to watch.

If the support holds, the pattern suggests that the price could begin to coil within the triangle. This setup may lead to a breakout above the descending trendline. Based on Fibonacci retracement levels, the next resistance areas are near $0.4, $0.42, and $0.44.
If the breakout plays out fully, XLM could reach $0.50. A break below $0.35, however, may push the asset lower to the $0.34–$0.33 range.
Indicators Show Weak Momentum
On the daily chart, the MACD shows bearish signs. The MACD line is below the signal line, and both remain in negative territory. The histogram bars are red and widening, which reflects growing selling pressure.
The RSI is now at 39, below the mid-point of 50. This reading confirms that current momentum favors sellers. While not in oversold territory yet, the RSI is approaching levels where buyers have stepped in before.
Data from Coinglass shows that XLM futures open interest surged in late October and early November, peaking above $500 million during a strong price move toward $0.60. Since then, open interest has declined along with price, returning to more moderate levels.
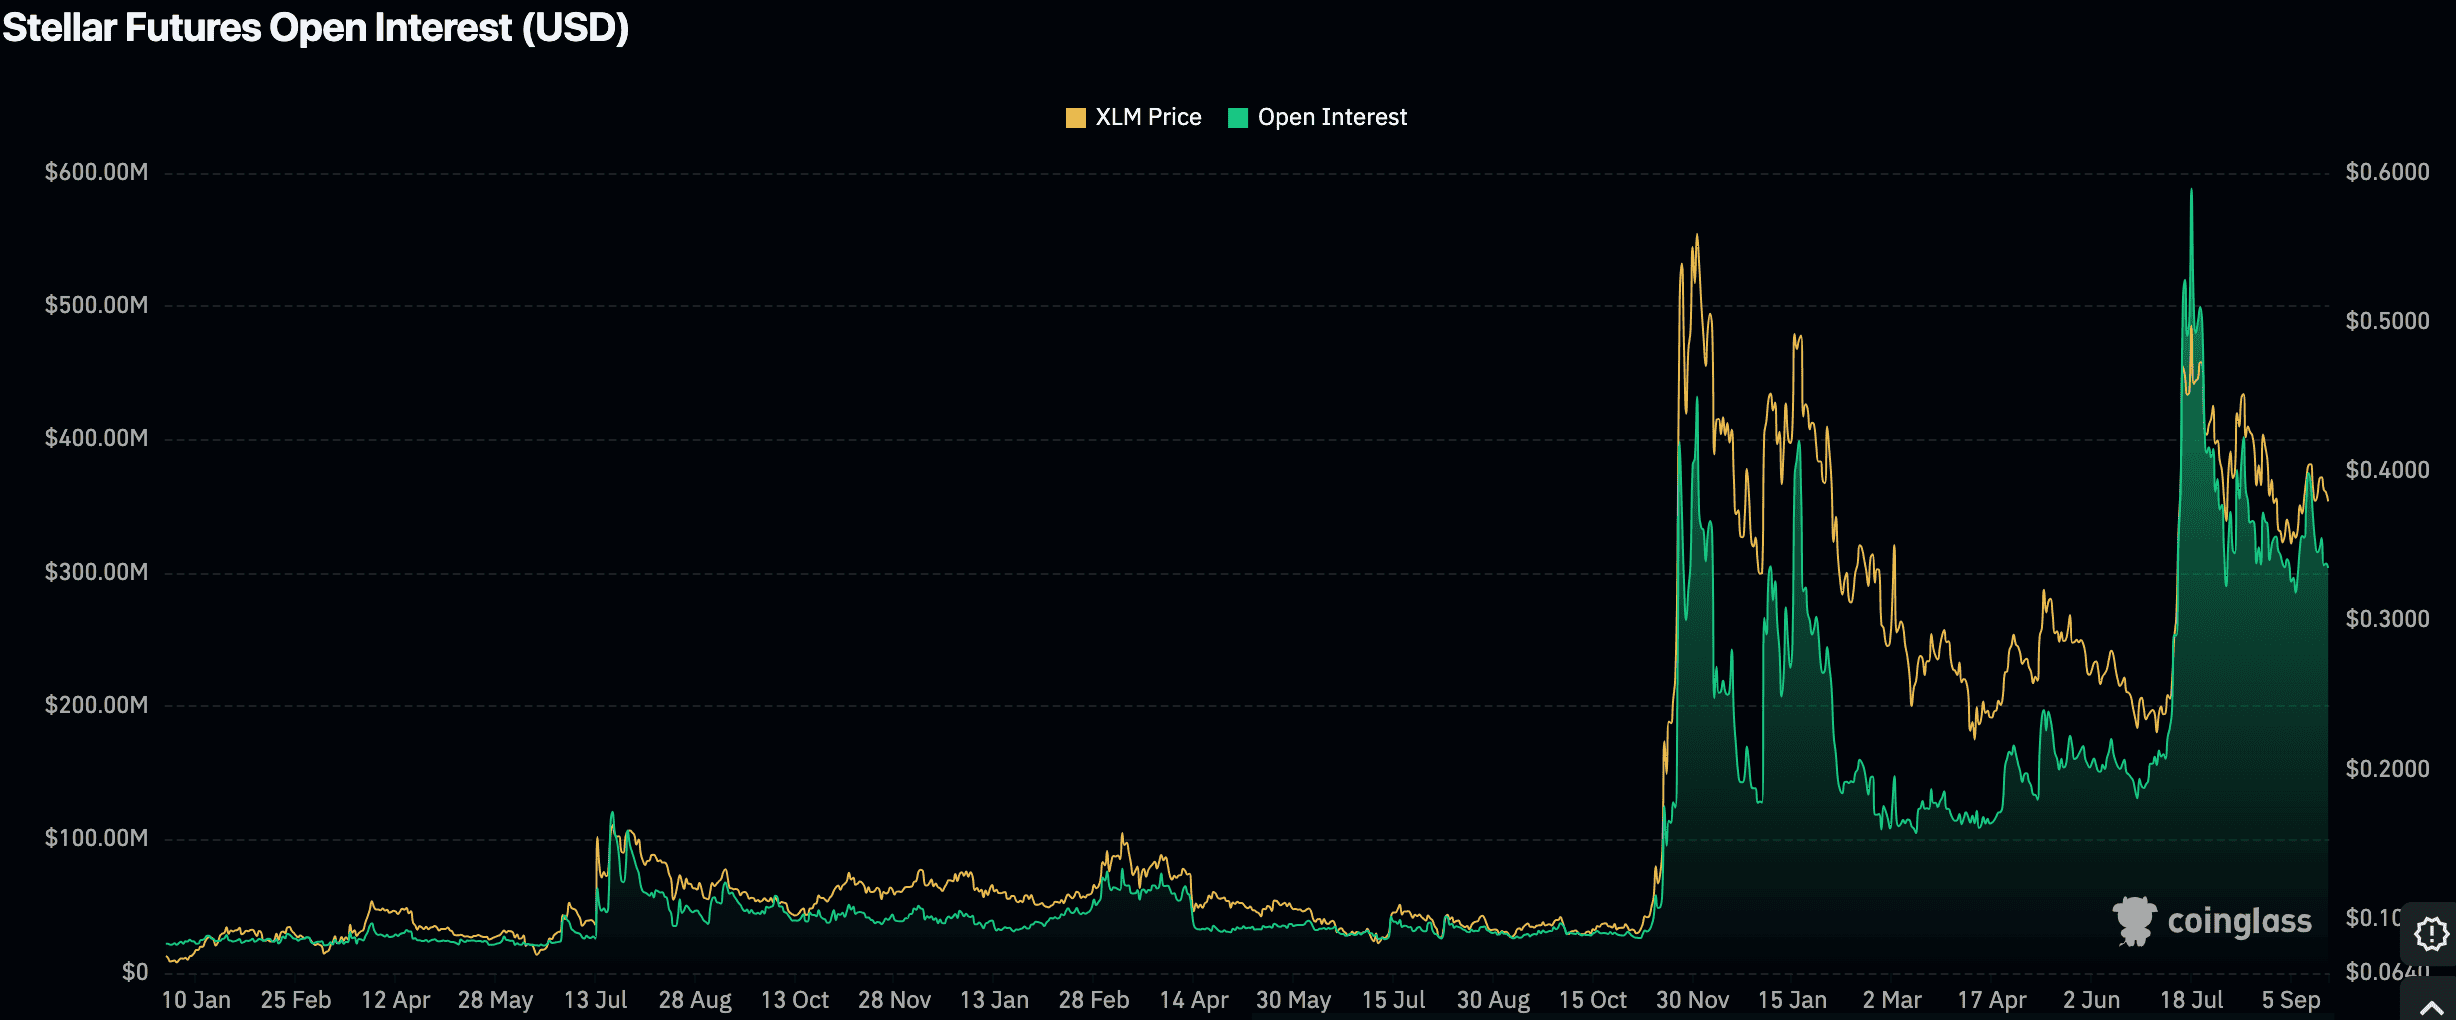
Meanwhile, the drop in open interest may reflect reduced activity from leveraged positions. This type of cooling off often follows periods of heightened speculation and can be a sign that traders are waiting for a clearer direction.
The post Is This the Calm Before XLM’s Jump to $0.50? appeared first on CryptoPotato.
Related Articles

BTCC Exchange Partners with NBA All-Star Jaren Jackson Jr. to Inspire Smarter Moves in Sports and Crypto
[PRESS RELEASE – VILNIUS, Lithuania, September 24th, 2025] BTCC, the world’s longest-serving...

Nebeus Overfunds Equity Crowdfunding Campaign with €3.6M Raised, Reflecting Growing Demand for Regulated Crypto–Finance Solutions
[PRESS RELEASE -London, United Kingdom, September 24th, 2025] Nebeus has exceeded its...

Shiba Inu price hits crucial support as whales quietly accumulate
Shiba Inu crashed to a crucial support level as on-chain metrics points...

Bitcoin price prediction: ETF flows fuel talk of a push toward $120K
Bitcoin just broke above $113K, finally snapping out of its recent consolidation...
Leave a comment