


BNB Price Surges to Fresh ATH – Can Bulls Push Toward $1K?

BNB price is gaining pace above the $885 zone. The price is now showing positive signs and might aim for a move above the $920 level in the near term.
- BNB price started a fresh increase above the $880 and $900 levels.
- The price is now trading above $900 and the 100-hourly simple moving average.
- There is a key bullish trend line forming with support at $898 on the hourly chart of the BNB/USD pair (data source from Binance).
- The pair must stay above the $885 level to start another increase in the near term.
BNB Price Extends Gains
BNB price formed a base above the $850 level and started a fresh increase, beating Ethereum and Bitcoin. There was a steady move above the $870 and $885 levels.
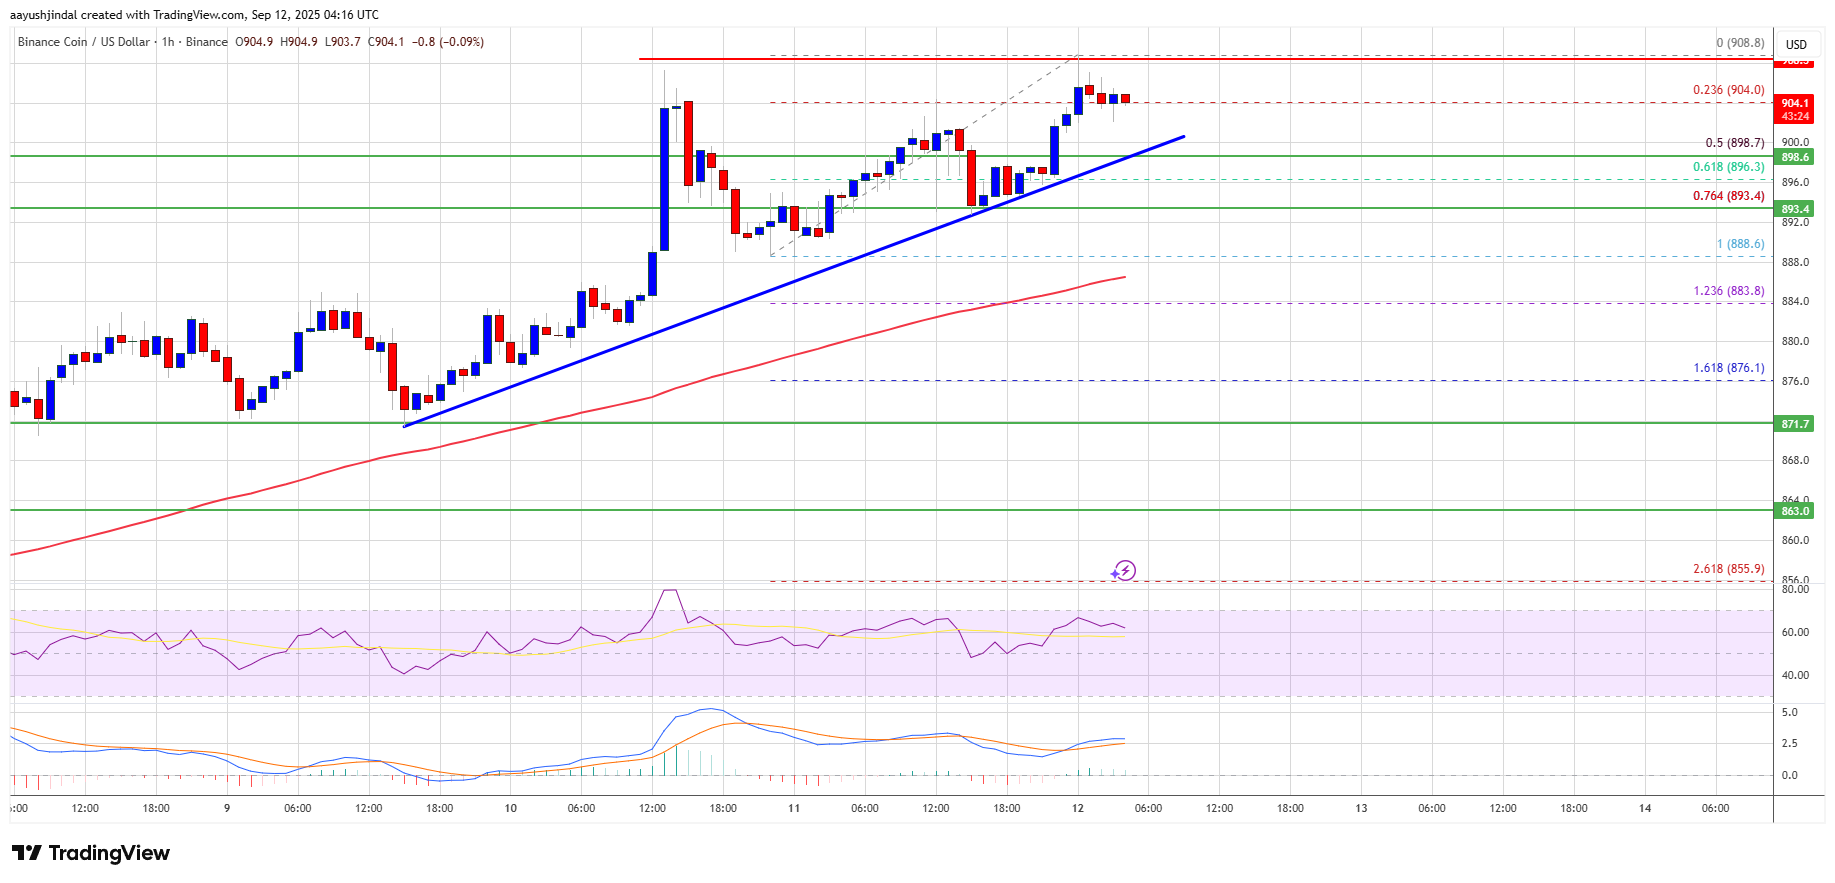
The bulls even cleared the $895 resistance zone. A new all-time high was formed at $908 and the price is now consolidating gains. It is trading near the 23.6% Fib retracement level of the upward move from the $888 swing low to the $908 high.
The price is now trading above $900 and the 100-hourly simple moving average. Besides, there is a key bullish trend line forming with support at $898 on the hourly chart of the BNB/USD pair.
On the upside, the price could face resistance near the $908 level. The next resistance sits near the $912 level. A clear move above the $912 zone could send the price higher. In the stated case, BNB price could test $920. A close above the $920 resistance might set the pace for a larger move toward the $945 resistance. Any more gains might call for a test of the $1,000 handle in the near term.
Short-Term Pullback?
If BNB fails to clear the $908 resistance, it could start another decline. Initial support on the downside is near the $898 level. The next major support is near the $893 level or the 76.4% Fib retracement level of the upward move from the $888 swing low to the $908 high.
The main support sits at $888. If there is a downside break below the $888 support, the price could drop toward the $872 support. Any more losses could initiate a larger decline toward the $865 level.
Technical Indicators
Hourly MACD – The MACD for BNB/USD is gaining pace in the bullish zone.
Hourly RSI (Relative Strength Index) – The RSI for BNB/USD is currently above the 50 level.
Major Support Levels – $898 and $888.
Major Resistance Levels – $908 and $920.

Related Articles

UK Bitcoin treasury company Smarter Web Company weighs acquisitions
UK Bitcoin treasury firm Smarter Web may look to acquire competitors at...

Bitcoin ‘sharks’ add 65K BTC in a week in key demand rebound
Bitcoin is a “buy” again for some investor cohorts, with sharks standing...

Dogecoin RSI Signal Returns—Last Time It Sparked A 1,700% Rally
Dogecoin is approaching a familiar inflection on the monthly chart that previously...

Kamino price breaks out of falling wedge after Coinbase listing, can it rally to $1?
KMNO price has broken out of a falling wedge after securing a...
Leave a comment