
XLM Charts Signal $1 Move as Pattern Takes Shape

TL;DR
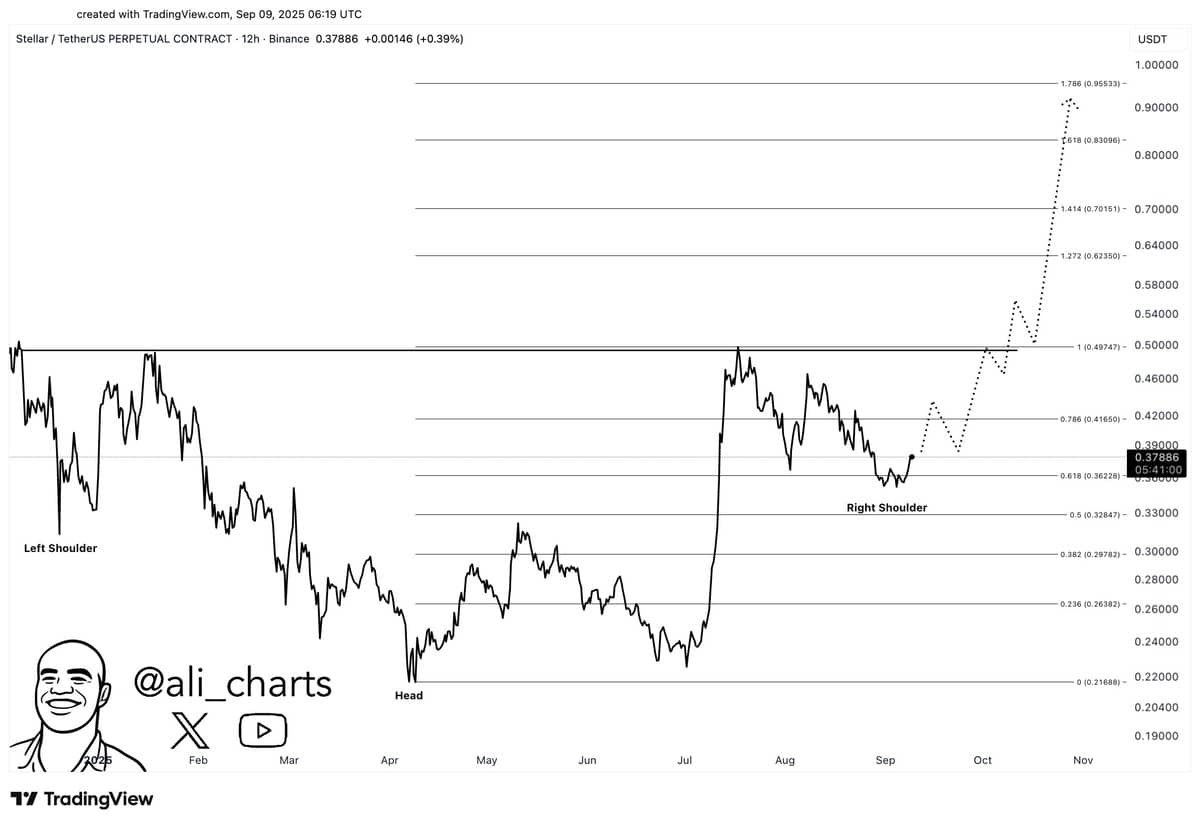
- XLM forms inverse head and shoulders with a neckline at $0.50, with a potential target near $1.00.
- SuperTrend flips bullish above $0.372, showing short-term reversal with support at $0.37 zone.
- Net inflow of $874.71K signals mild selling pressure, but overall sentiment remains consolidated.
Pattern Structure Builds Toward Breakout
Stellar (XLM) is forming an inverse head and shoulders pattern on the 12-hour chart, according to analysis shared by crypto analyst Ali Martinez. The pattern includes a left shoulder in the January–February period, a lower low in April–May forming the head, and a right shoulder that began forming in August. The neckline sits near the $0.50 level.
Notably, XLM is trading around $0.38, above the 0.618 Fibonacci retracement level at $0.36. A confirmed breakout above $0.50 may lead to further gains, with Fibonacci extension levels marking potential resistance at $0.62, $0.70, $0.83, and $0.95. The structure’s final target appears just below the $1.00 mark. Support levels are noted at $0.36, $0.33, and $0.30 in the event the breakout fails.
He noted,
“Stellar $XLM forms the right shoulder of a head and shoulders pattern. Bullish breakout could target $1!”
SuperTrend Indicator Flips Bullish
The 4-hour chart shows a bullish shift, with the SuperTrend indicator turning positive for the first time since August 25. This move followed a breakout above the $0.372 resistance level, suggesting a change in short-term momentum.
A “Buy” signal appeared on the chart as the price moved above the SuperTrend band. If the asset holds above $0.37, a move toward $0.38–$0.39 is possible. A decline below $0.365 would weaken the setup.
Stellar $XLM flipped bullish for the first time since August 25, according to the SuperTrend indicator. pic.twitter.com/wTGIl3D6l5
— Ali (@ali_charts) September 9, 2025
XLM trades at around $0.38 at press time. The 24-hour trading volume is $264.46 million, with a 1% drop over the last day. Over the past week, the asset has increased by 4%, trading within a narrow range between $0.30 and $0.40.
The market remains in a consolidation phase, with no clear signs of either strong accumulation or distribution. Buyers and sellers appear evenly matched at current levels.
Netflow Data Shows Mild Exchange Inflows
As of September 10, data shows that XLM recorded a net inflow of $874.71K to spot exchanges. This indicates more XLM was deposited than withdrawn, which can suggest near-term selling activity.
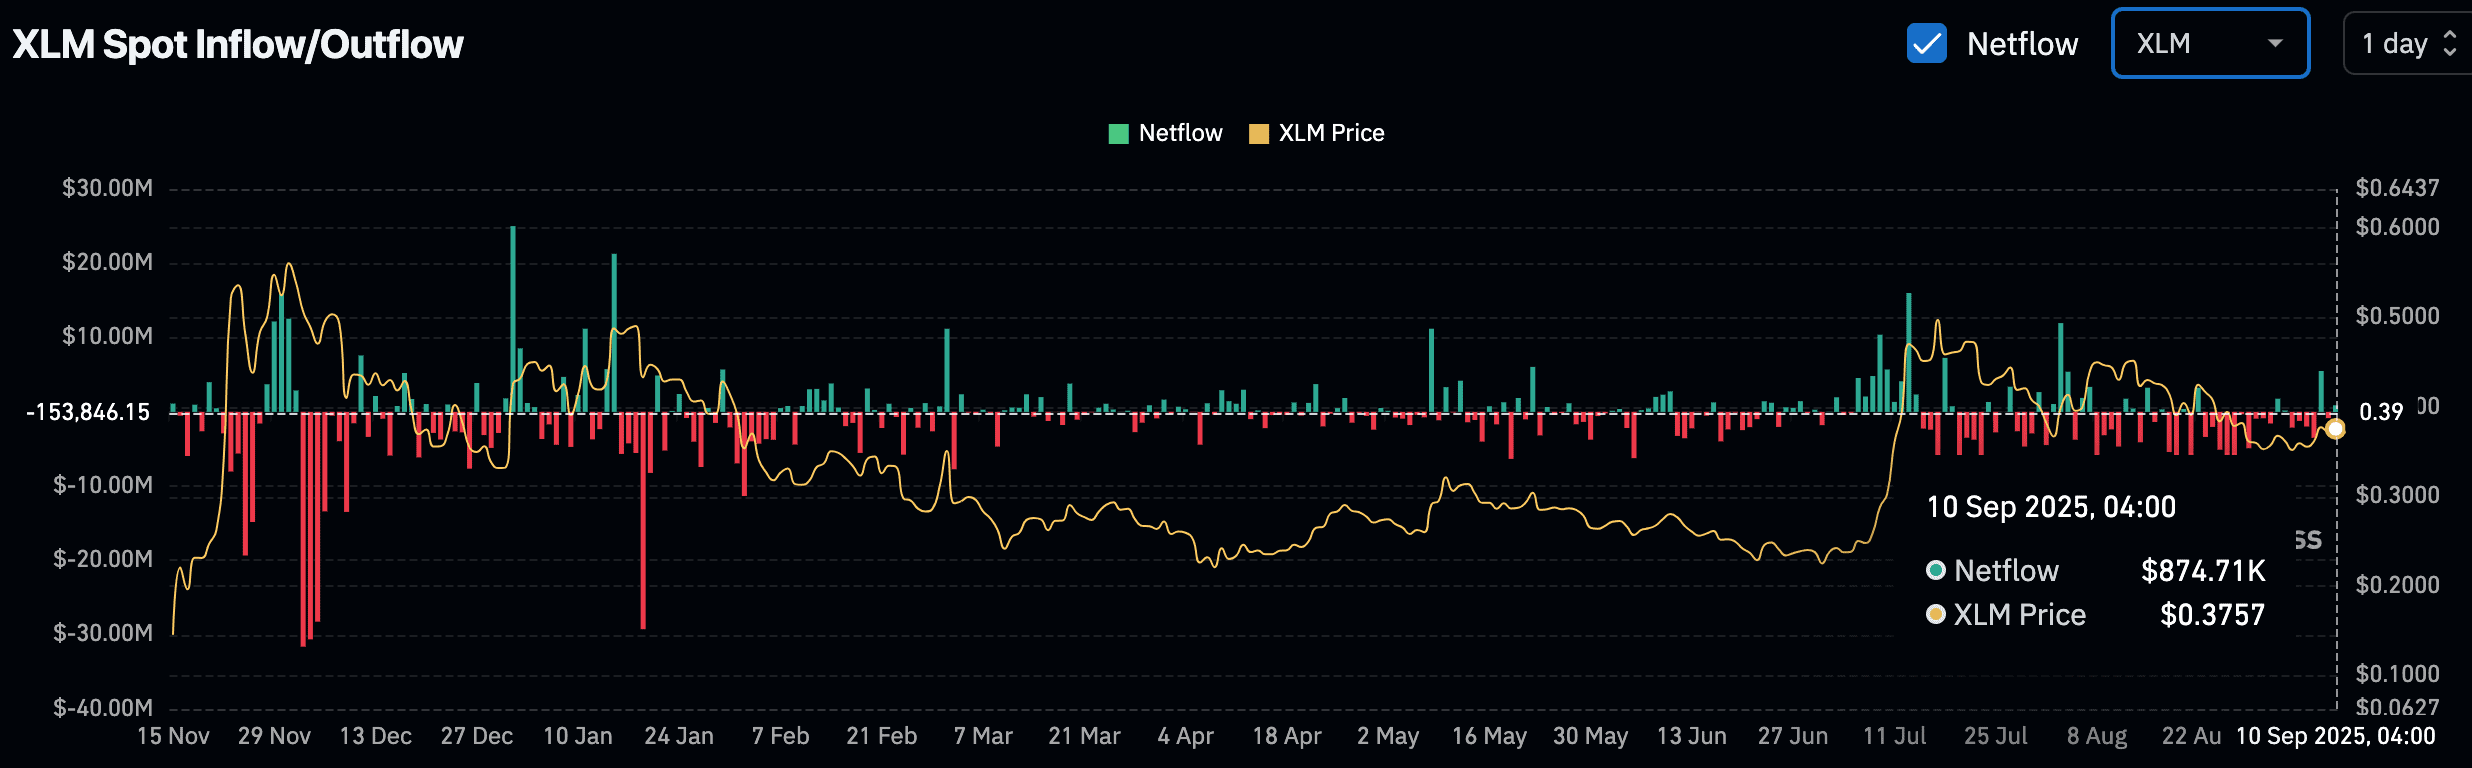
Although the inflow is positive, the size is small compared to earlier spikes on the chart, some of which exceeded $20 million. The movement likely reflects routine positioning rather than a major sentiment shift.
The post XLM Charts Signal $1 Move as Pattern Takes Shape appeared first on CryptoPotato.

Related Articles

Vana Foundation launches Playground for AI devs with 12.7M data points
Vana Playground will help AI developers train their models with 12.7 million...

Ethereum Network Activity Heats Up As Fees Hit $1.4M In 24H
Ethereum has recently come under selling pressure, pausing the relentless bullish momentum...

Ledger Enterprise launches mobile app with full TRON network support
Ledger’s app enhances secure, agile stablecoin operations, potentially boosting institutional participation in...

Binance price prints a new all-time high, is a rally to $1,100 next?
Binance blue sky breakout suggests higher prices to come.
Leave a comment