


Ripple Price Analysis: XRP Coiling Pattern Signals Explosive Next Step
Ripple has been trading sideways against both USDT and BTC after its strong rally back in July. With Bitcoin’s recent pullback, concerns are growing among investors that the broader bull market could be fading, which in turn raises the risk of XRP also heading lower.
Technical Analysis
By Shayan
The USDT Pair
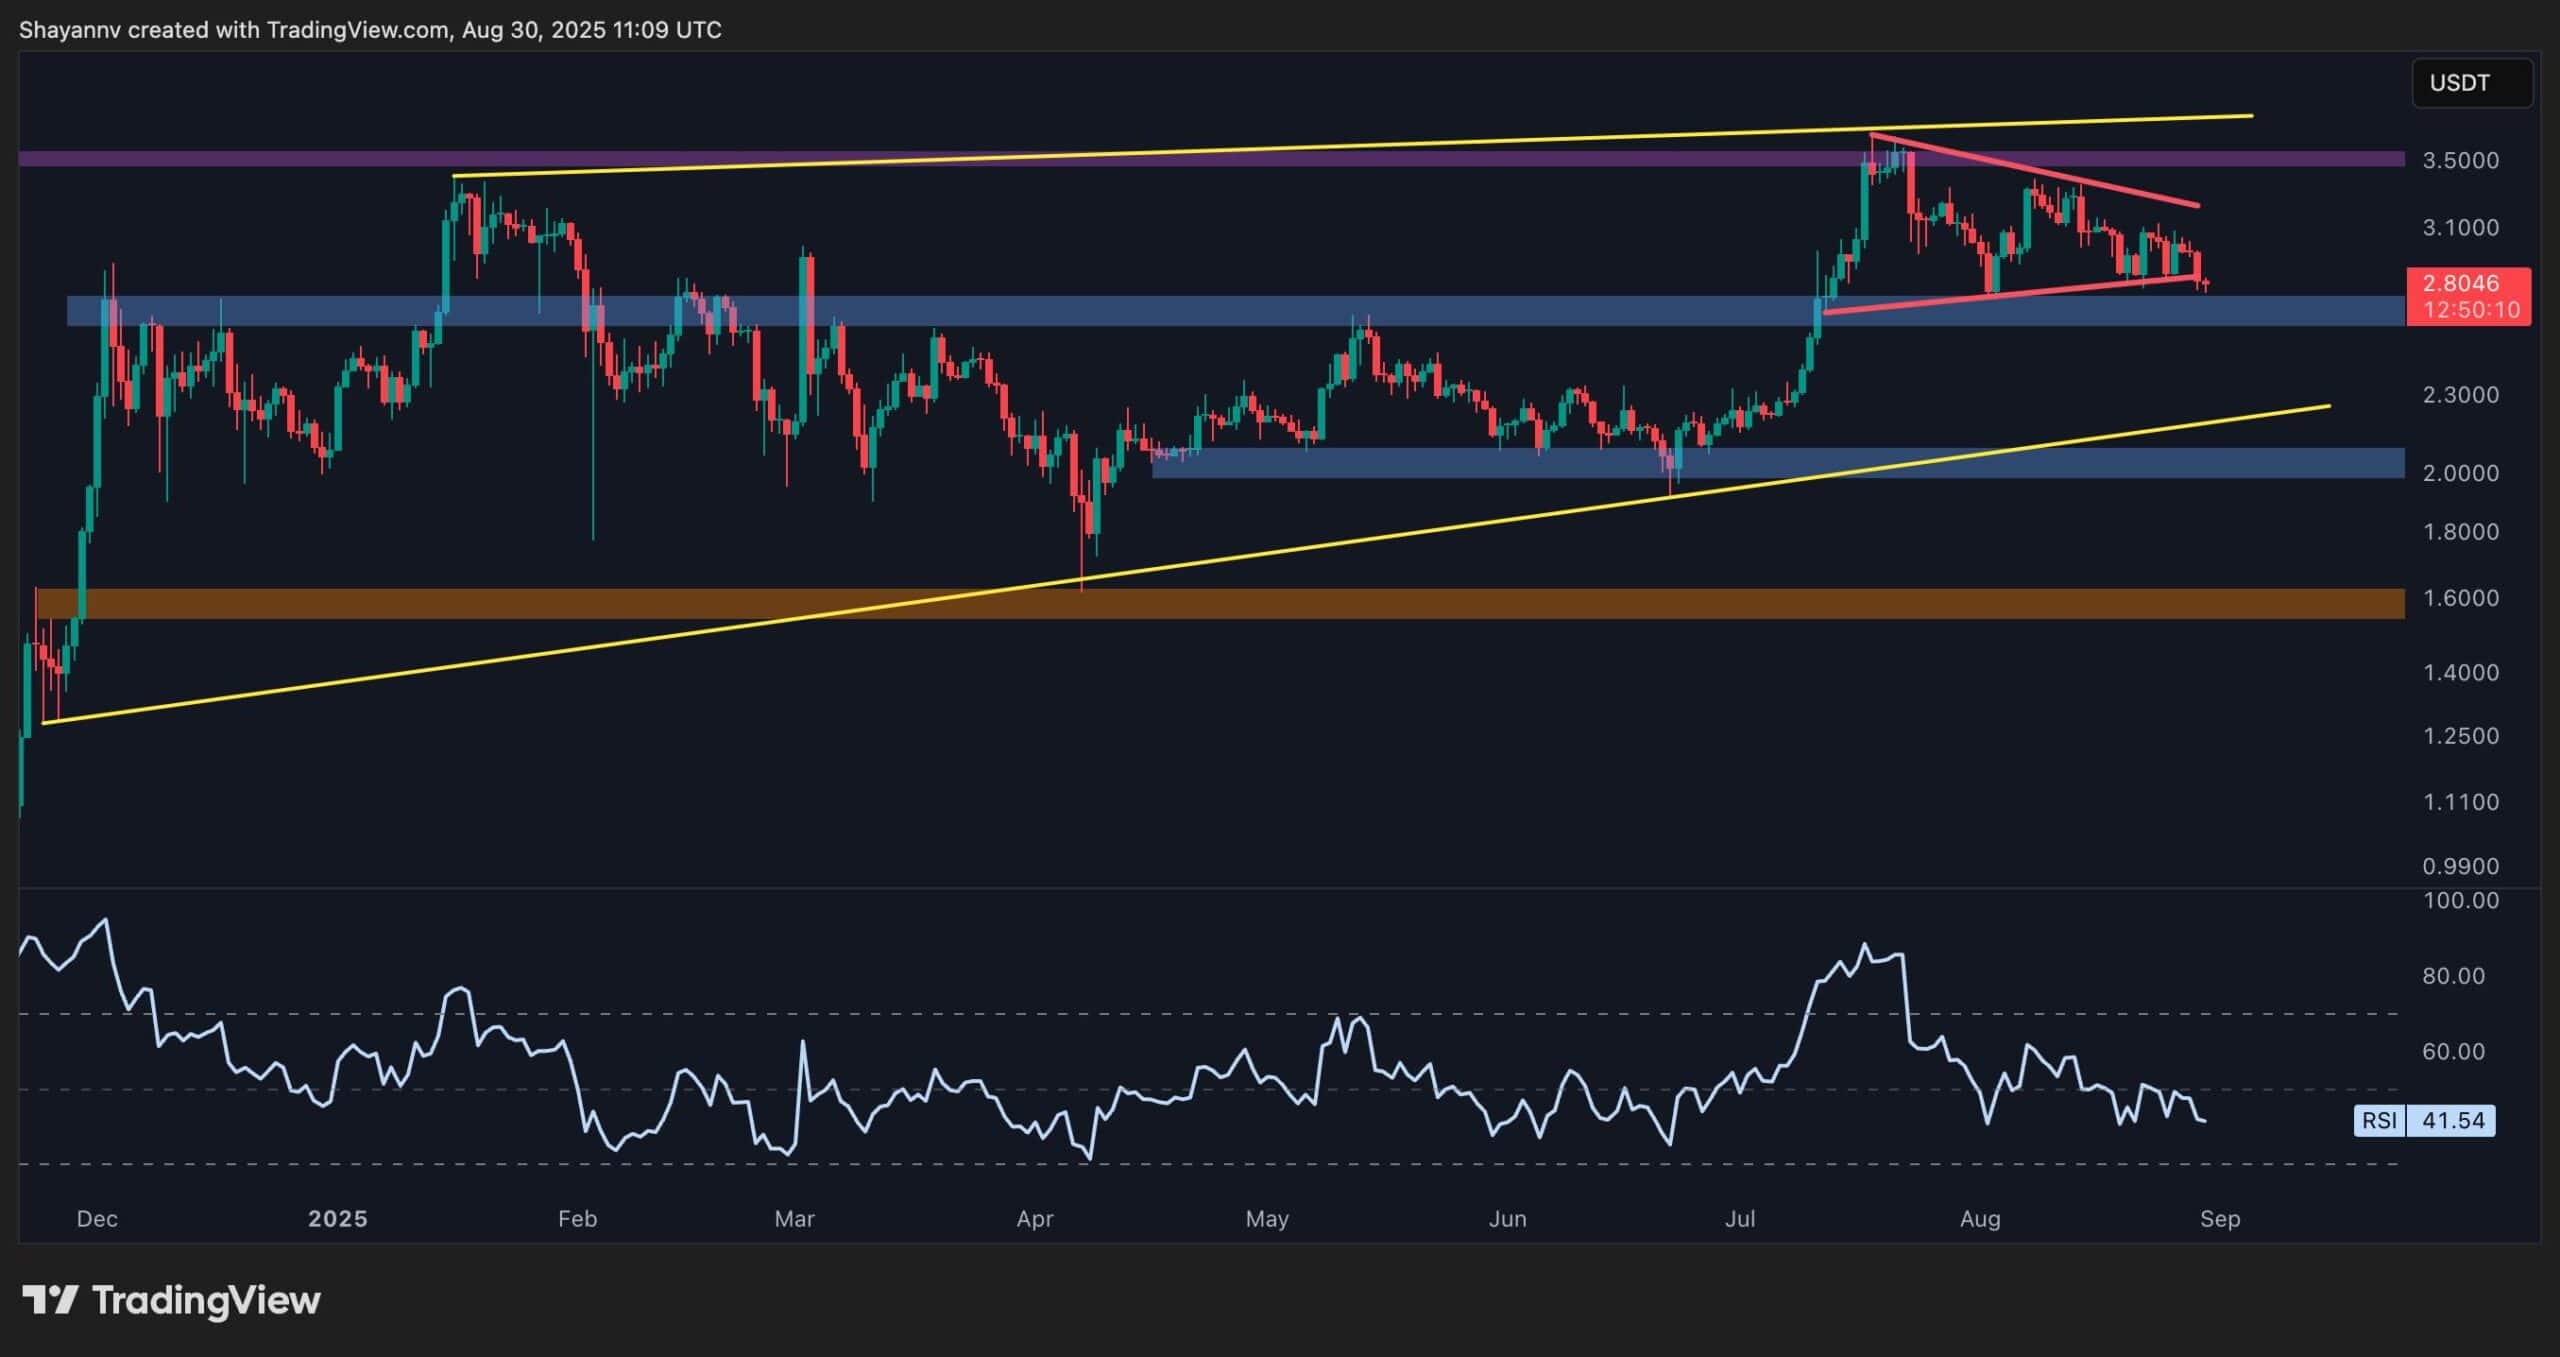
On the daily timeframe of the USDT pair, the market has been consolidating in a relatively tight range, forming a symmetrical triangle pattern. This type of structure usually signals that a decisive move is on the horizon, as price coils up before expanding again.
Currently, the bias leans slightly to the downside, as the triangle appears weaker with each retest of support. If sellers gain momentum, the next major level to watch will be the $2.70 support zone. This level has already acted as an important pivot in the past, so another breakdown could set the stage for a sharper selloff.
Adding to the bearish case, the RSI is currently holding below the 50 midpoint, which is a clear indication that momentum is favouring the sellers. As long as the RSI remains subdued, the probability of a breakdown below $2.70 is higher than a bullish rebound.
If that breakdown occurs, the market could continue to slide until it reaches the lower boundary of the broader ascending channel. Of course, this outlook would only shift if market dynamics change suddenly in favor of the bulls, with stronger buying activity stepping in to push the price out of the triangle to the upside.
The BTC Pair
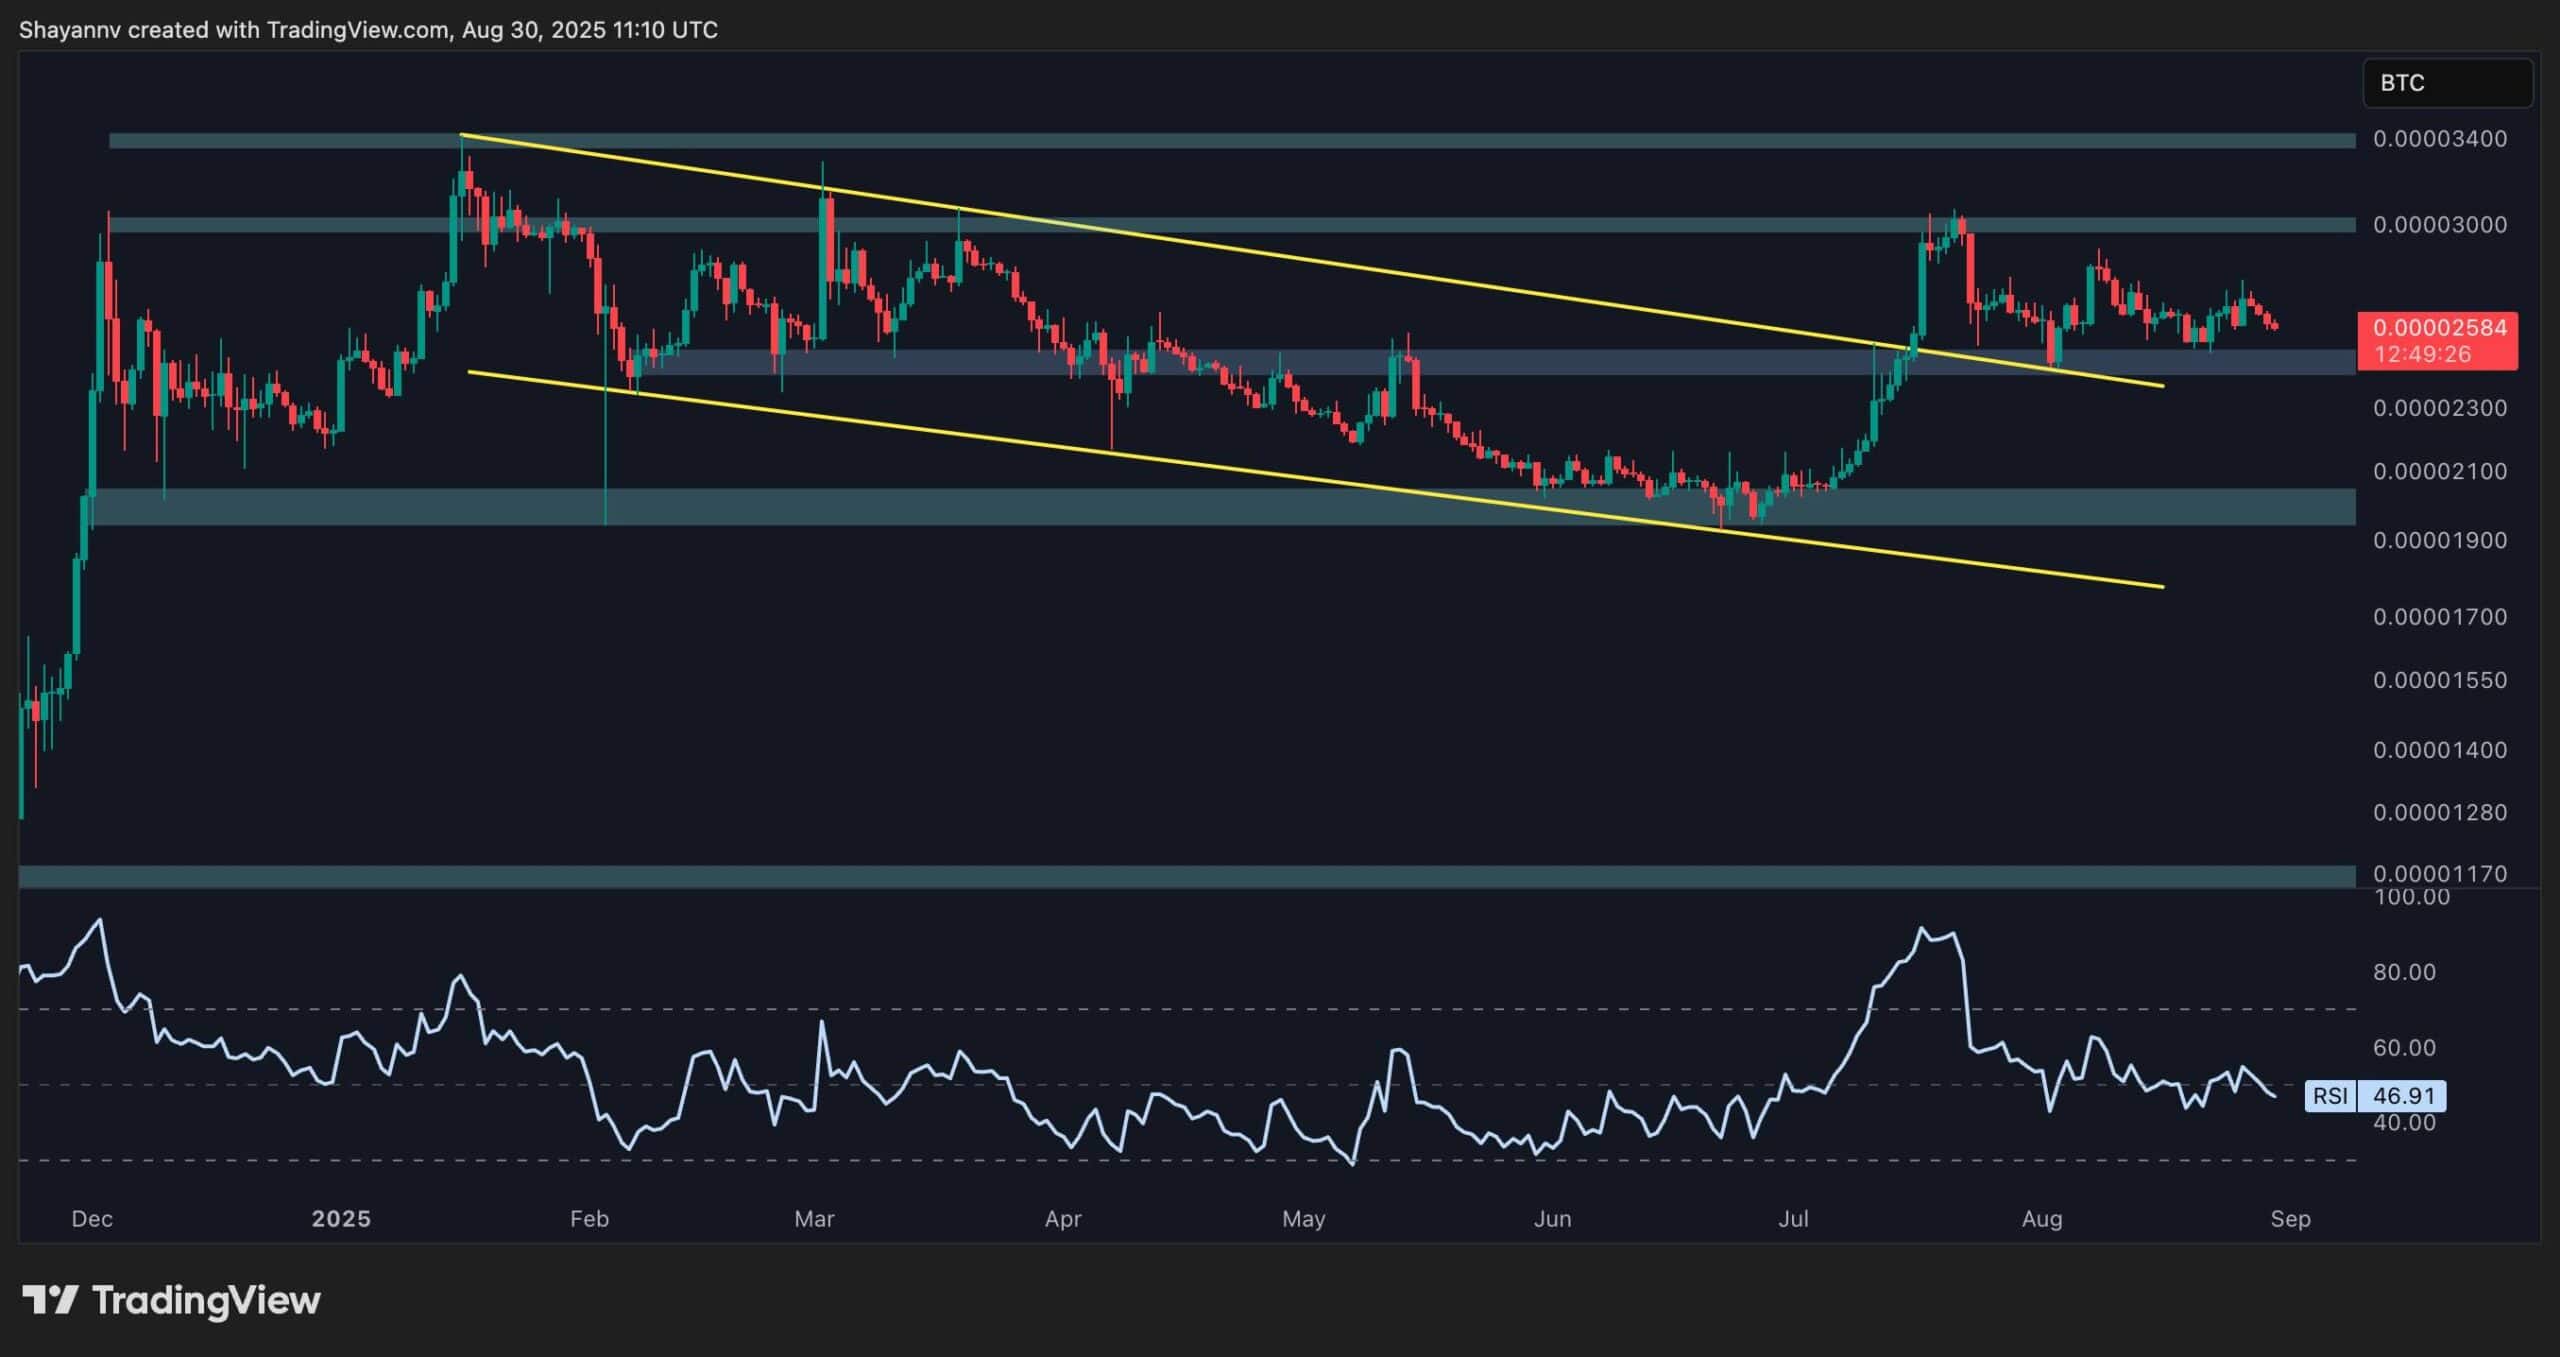
On the XRP/BTC chart, the price has also been consolidating, holding above a major support area. July’s surge, however, managed to push the market out of a long-term descending channel, which has tilted the broader structure to the bullish side.
The RSI sitting near the neutral 50 level reflects uncertainty, as traders appear to be waiting for a decisive move. If the 2,500 SAT support holds, the market could attempt another rally targeting the 3,000 SAT zone. But if 2,500 SAT fails, the price would likely fall back inside the old channel, opening the door for a drop toward 2,000 SAT. Such a move would confirm a bearish reversal and add further pressure on XRP holders.
The post Ripple Price Analysis: XRP Coiling Pattern Signals Explosive Next Step appeared first on CryptoPotato.
Related Articles

AI models prefer Bitcoin over fiat as top store of value, research shows
A new study from the Bitcoin Policy Institute finds that leading artificial...

Korea halts trading as key indexes drop 10% on Middle East crisis
South Korea’s Kospi and Kosdaq tripped circuit breakers as the Middle East...

U.S. shifts $23,000 in seized Bitcoin as ‘Villanueva’ wallet empties
A wallet on the Bitcoin blockchain associated with U.S. government seizure funds...

Bitcoin LTH Selling Cools: Is Months-Long Distribution Finally Ending?
On-chain data shows Bitcoin long-term holders (LTHs) have seen their netflow rise...
Leave a comment