- Home
- Advertise With us
- World News
- Tech
- Entertainment
- Travels & Tours
- Contact US
- About us
- Privacy Policy
Top Insights
Bitcoin Price Eyes $123K Explosion—Traders Brace for Breakout

Bitcoin price is attempting a fresh increase above $120,000. BTC is now consolidating and might attempt a steady move toward the $125,000 zone.
- Bitcoin started a fresh increase from the $115,800 zone.
- The price is trading above $119,000 and the 100 hourly Simple moving average.
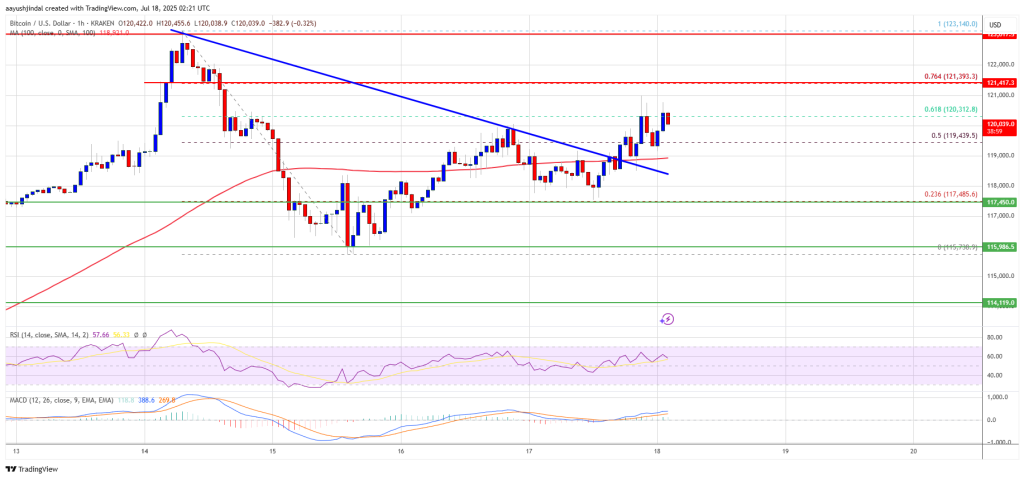
- There was a break above a bearish trend line with resistance at $119,000 on the hourly chart of the BTC/USD pair (data feed from Kraken).
- The pair might start another increase if it clears the $120,500 resistance zone.
Bitcoin Price Eyes Fresh Upward Move
Bitcoin price started a correction from the new high at $123,200. BTC dipped below the $120,000 level and tested the $115,500 zone.
A low was formed at $115,730 and the price is now attempting a fresh increase. The bulls were above to push the price above the $118,000 and $118,500 resistance levels. There was a move above the 50% Fib retracement level of the move from the $123,140 swing high to the $115,730 low.
Besides, there was a break above a bearish trend line with resistance at $119,000 on the hourly chart of the BTC/USD pair. Bitcoin is now trading above $119,500 and the 100 hourly Simple moving average.
Immediate resistance on the upside is near the $120,200 level. The first key resistance is near the $121,400 level. It is close to the 76.4% Fib retracement level of the move from the $123,140 swing high to the $115,730 low. The next resistance could be $123,150.
A close above the $123,150 resistance might send the price further higher. In the stated case, the price could rise and test the $124,200 resistance level. Any more gains might send the price toward the $125,000 level. The main target could be $126,200.
Another Decline In BTC?
If Bitcoin fails to rise above the $121,400 resistance zone, it could start another decline. Immediate support is near the $119,000 level and the 100 hourly SMA. The first major support is near the $117,500 level.
The next support is now near the $115,500 zone. Any more losses might send the price toward the $113,500 support in the near term. The main support sits at $110,500, below which BTC might continue to move down.
Technical indicators:
Hourly MACD – The MACD is now losing pace in the bullish zone.
Hourly RSI (Relative Strength Index) – The RSI for BTC/USD is now above the 50 level.
Major Support Levels – $117,500, followed by $115,500.
Major Resistance Levels – $121,400 and $123,150.
Related Articles
KuCoin Launches xStocks, Delivering a One-Stop Access Point to Top Global Tokenized Equities
[PRESS RELEASE – VICTORIA, Seychelles, July 18th, 2025] On July 18, 2025,...
XRP jumps 22% into price discovery as market cap hits a record $210B
XRP’s rally to $3.66 all-time high came amid the passage of major...
DeFi backbone of ASI Alliance Singularity Finance unveils H2 2025 roadmap
Singularity Finance, the ASI Alliance’s financial arm, has released its H2 2025...
Dogecoin Erupts Past $0.23—Analyst Predicts Next Price Targets
The latest burst of momentum has carried the Dogecoin price through the...


Leave a comment