


Solana Gears Up For Wild Ride: Unpacking SOL USD Price Action In June

Solana was in the headlines for a long time. Though the community has been rather silent lately, the price has not increased as some expected. Is it over, or is there more bread in the token? While long-term SOL USD investors are probably not that concerned, since nothing has changed on a fundamental level, downside price action is unignorable recently, even as the Solana ETFs are still pending approval.
We can see how powerful support has been for #SOLANA around the $SOL 141 level.
Another attempt will likely result in a bounce BUT a break could be decisive for a further downside price action.
This is actually really useful information for trade placement with well defined risk… pic.twitter.com/GgPH6ZJrif— Matthew Dixon – Veteran Financial Trader (@mdtrade) June 20, 2025
Matthew Dixon’s analysis and comments are excellent, especially for newer traders! Consider both ways the SOL USD price can go and manage risk with tight stops.
Zooming Out on SOL USD: Solana Price in the Long Time Frame
We’ve got three charts to look at – brace yourself!
(SOLUSD)
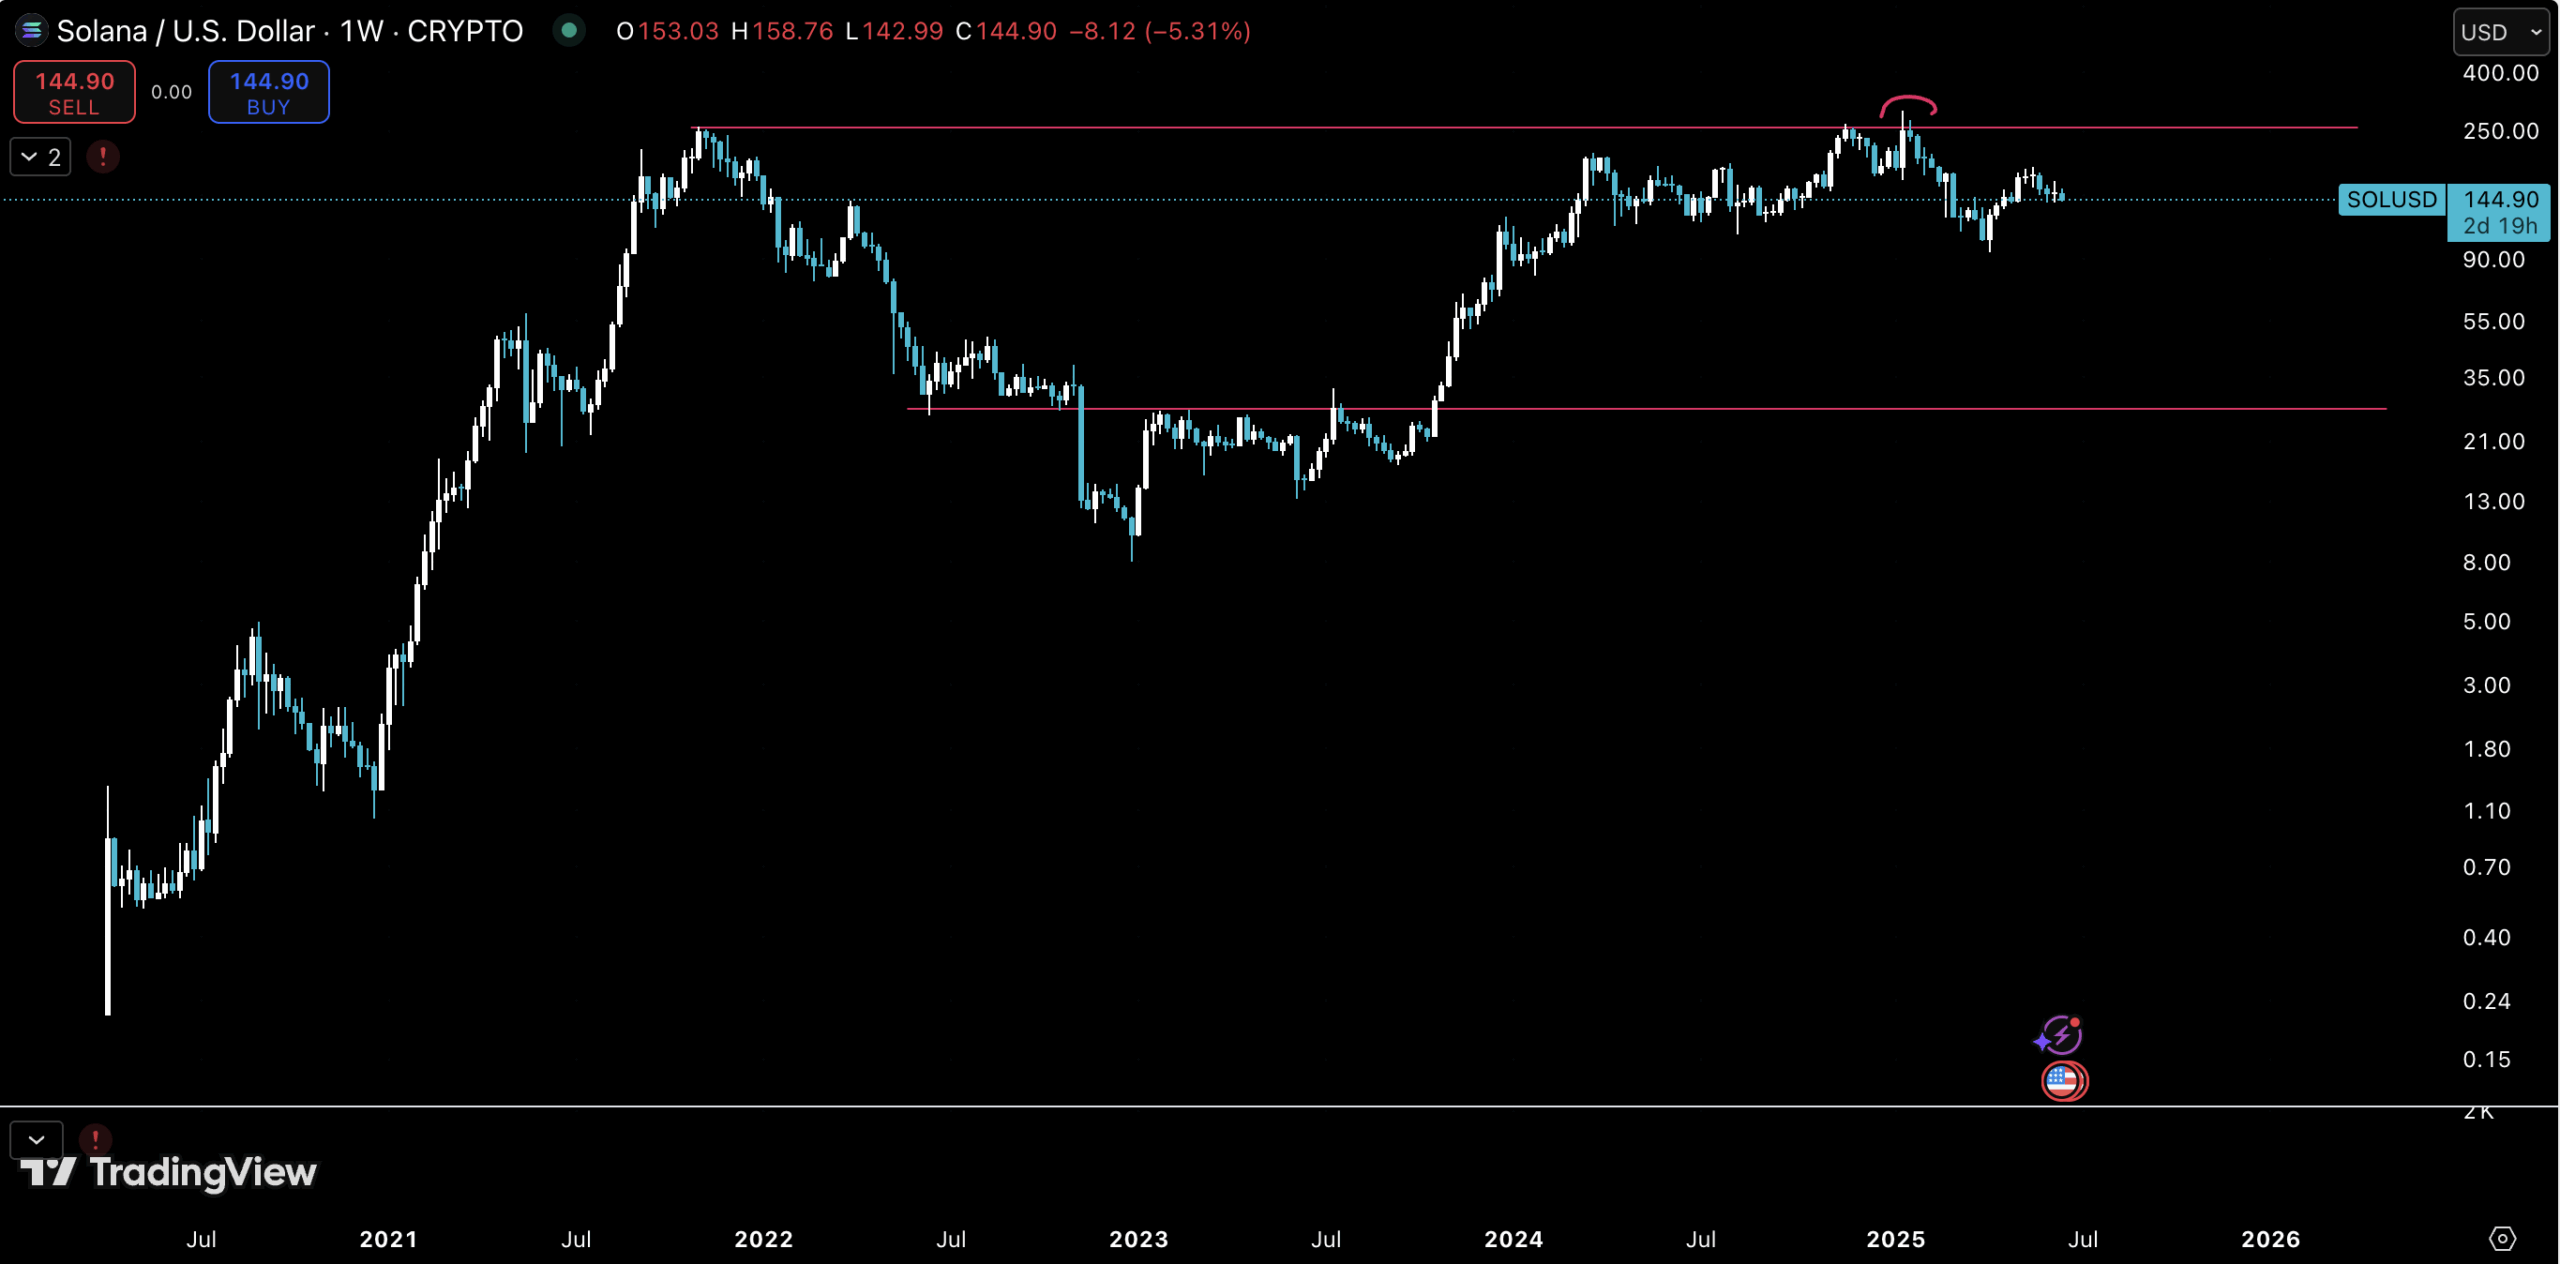
The first chart we will start our analysis on is the long-term Weekly timeframe, specifically looking at the bigger range. Solana’s price reached the 2021 bull run top at the end of 2025, which is our current resistance. In other words, it is the top of the range.
The bottom of the range might look very far down at $27. It’s good to remember that SOL spent almost a full year trading under $10 in its early days.
DISCOVER: Top Solana Meme Coins to Buy in 2025
Zooming In on Solana Price Action: Where Does SOL Go From Here?
(SOLUSD)
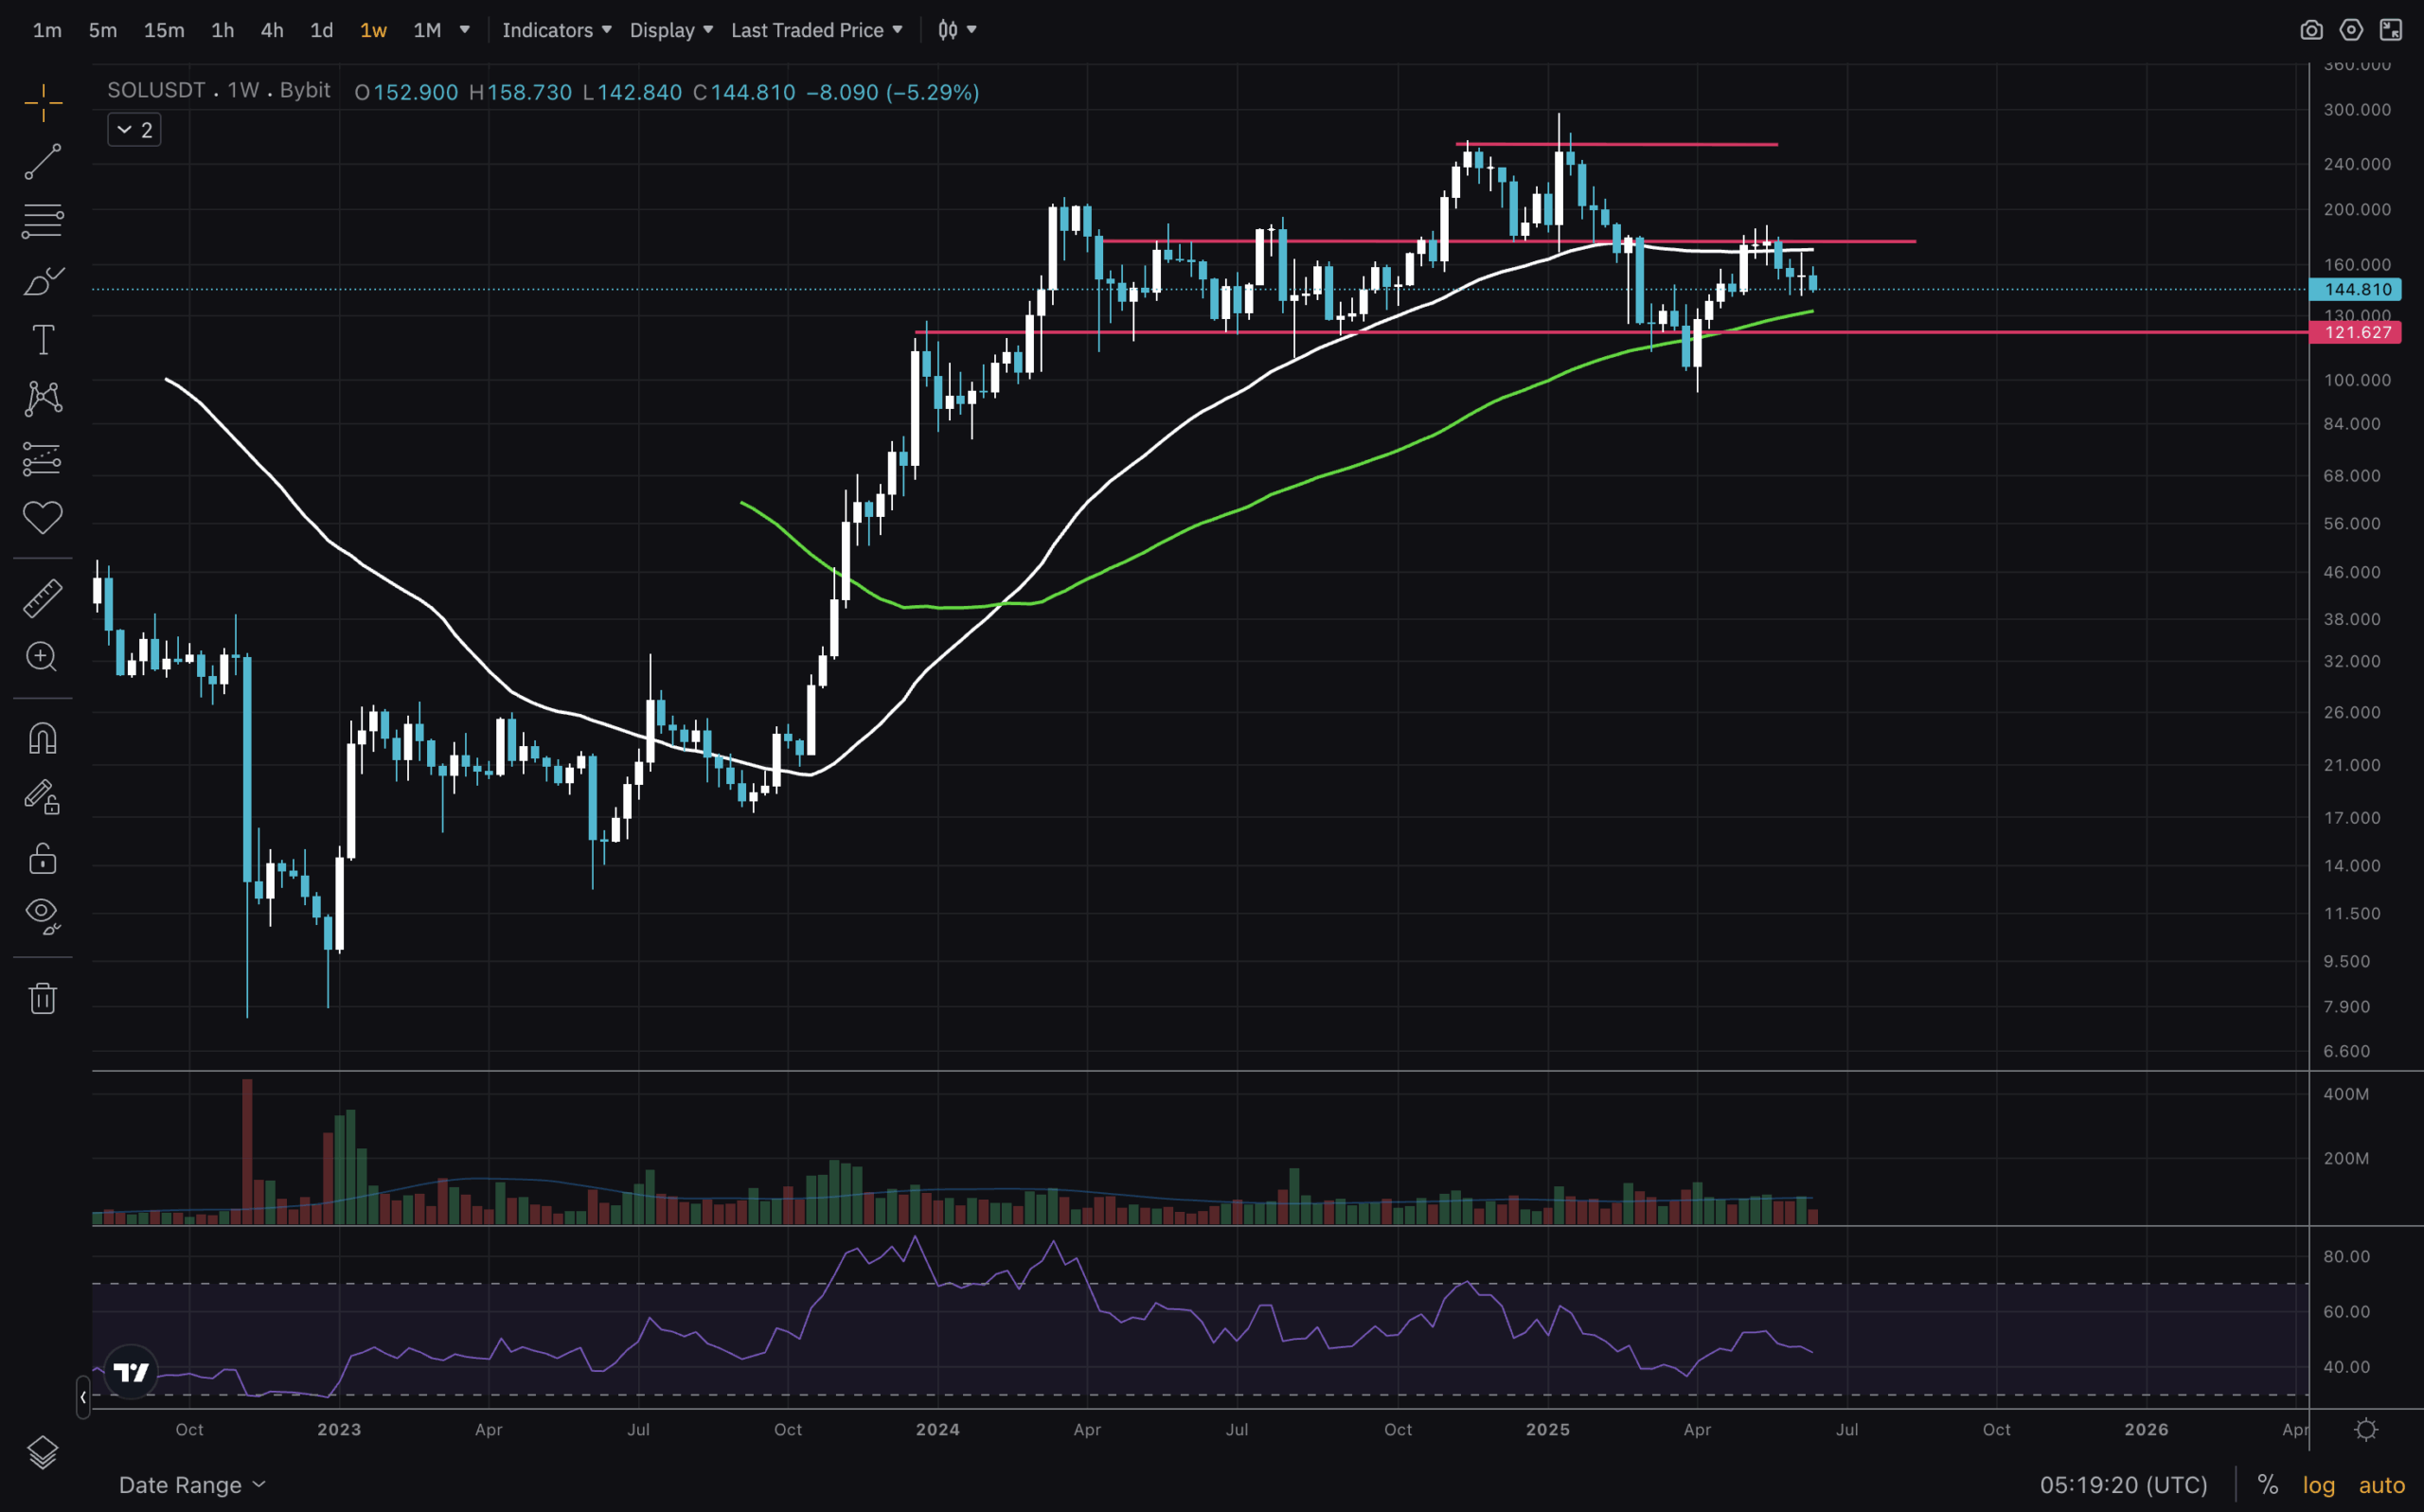
Another quick look at the 1W timeframe, and then we’ll move on. The latest run’s current bottom range and support cost ~$120. However, the price exceeded the MA50 and was rejected when retested as resistance. Soon, MA100 could be reached – good to watch the reaction. Lose the $120 level, and we might drop below $100.
DISCOVER: Top 20 Crypto to Buy in 2025
(SOLUSD)
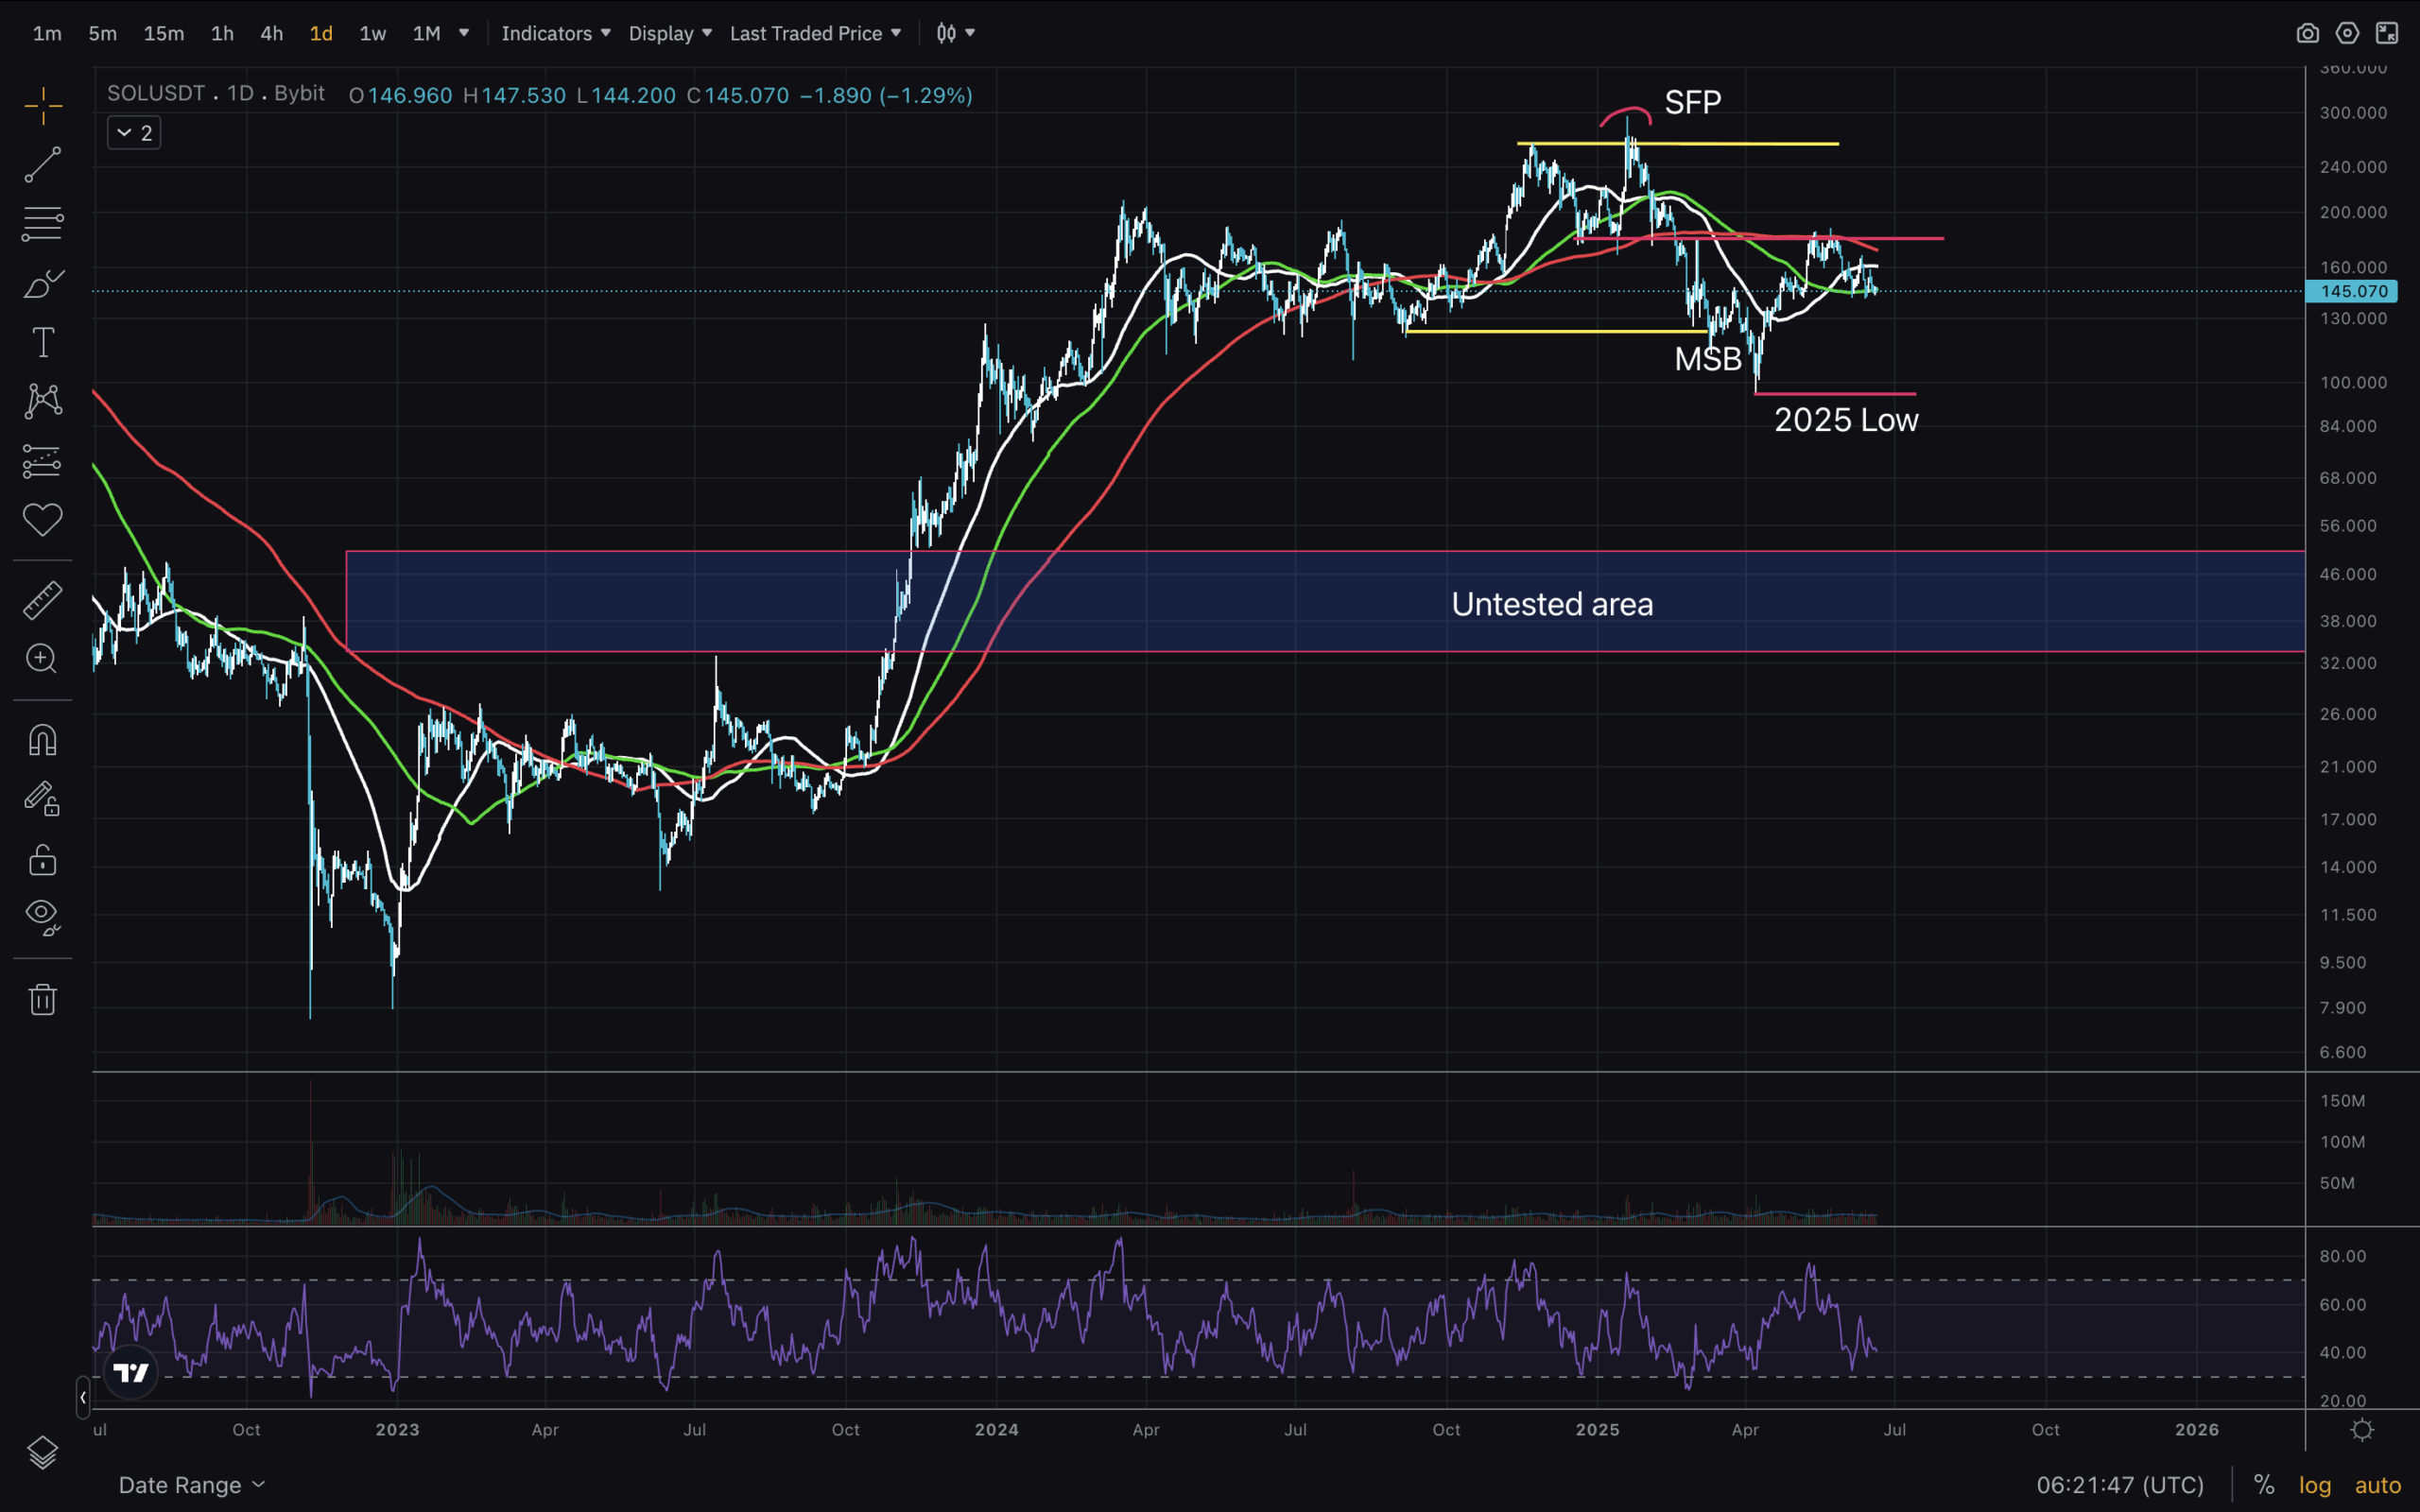
Zooming in on the 1D day, we can now see more details. A large untested area ranges from $32 to $50, though it can be extended to $100. We see a clear SFP, break of market structure, and retest of MA200, which was also the previous low, now acting as resistance. Quite the dynamic chart.
For me, it looks like SOL USD is heading lower, unless MA200 is reclaimed. As Matthew said in his X post, the market can move both ways, and it’s good to be ready for either of the two scenarios.
DISCOVER: Best Meme Coin ICOs to Invest in 2025
Join The 99Bitcoins News Discord Here For The Latest Market Updates
Solana Wild Ride: Unpacking The Latest Price Action
- Late 2023 and 2024 SOL saw huge gains.
- Untested price are starting beneath $100
- Price needs to reclaim MA200 on 1D for next leg higher
The post Solana Gears Up For Wild Ride: Unpacking SOL USD Price Action In June appeared first on 99Bitcoins.

Related Articles

Staked ETH eclipses 35m as crypto reserves fuel supply squeeze
With a record 35 million Ether now staked, liquidity is tightening as...

Norway Plans to Temporarily Ban New Bitcoin & Crypto Mining Centers to Conserve Energy
Bitcoin Magazine Norway Plans to Temporarily Ban New Bitcoin & Crypto Mining...

Crypto Biz: AI money rush could reshape digital asset industry
Cointelegraph moderated an AI funding panel at the Web Summit conference in...

Solana highlights 3,200 active devs, $1b+ app revenue for second straight quarter
Solana Foundation showcased the network’s achievements in the past quarter, and its...
Leave a comment