

Bitcoin Cash (BCH) Pops 8% Higher — Can The Momentum Continue?

Bitcoin Cash price started a major increase above the $475 resistance. BCH is consolidating and might aim for more gains above the $500 resistance.
- Bitcoin cash price started a fresh increase above the $480 level.
- The price is trading above $480 and the 100-hour simple moving average.
- There was a break above a key bearish trend line with resistance at $472 on the hourly chart of the BCH/USD pair (data feed from Kraken).
- The pair could start another increase if it clears the $500 resistance zone.
Bitcoin Cash Price Starts Fresh Surge
After forming a base above the $440 level, Bitcoin Cash price started a fresh increase. BCH outpaced Bitcoin and Ethereum to gain over 8%. There was a clear move above the $470 resistance zone.
The price even surpassed $480 and tested the $495 resistance zone. Besides, there was a break above a key bearish trend line with resistance at $472 on the hourly chart of the BCH/USD pair. A high was formed near $505 and the price is now consolidating gains above the 23.6% Fib retracement level of the upward move from the $455 swing low to the $502 high.
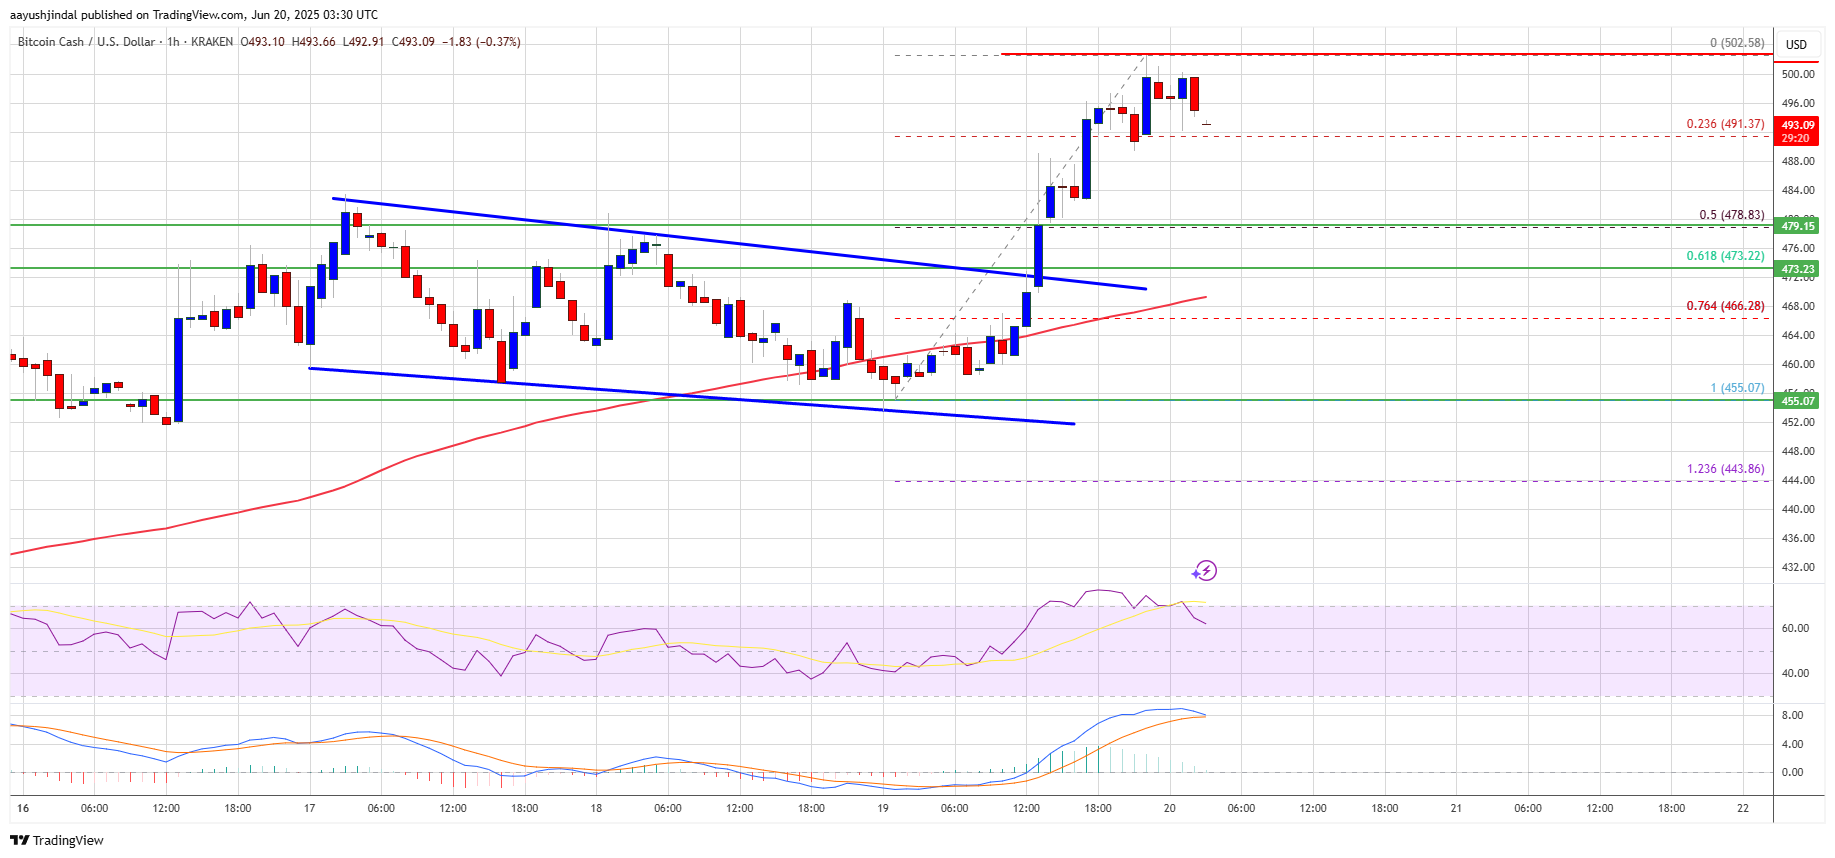
Bitcoin cash price is now trading above $485 and the 100-hour simple moving average. Immediate resistance on the upside sits near the $500 level. A clear move above the $500 resistance might start a decent increase. The next major resistance is $505, above which the price might accelerate higher toward the $520 level. Any further gains could lead the price toward the $535 resistance zone.
Are Dips Supported In BCH?
If Bitcoin Cash price fails to clear the $500 resistance, it could start a fresh decline. Initial support on the downside is near the $490 level. The next major support is near the $480 level or the 50% Fib retracement level of the upward move from the $455 swing low to the $502 high.
If the price fails to stay above the $480 support, the price could test the $470 support. Any further losses could lead the price toward the $450 zone in the near term.
Technical indicators
4-hour MACD – The MACD for BCH/USD is losing pace in the bullish zone.
4-hour RSI (Relative Strength Index) – The RSI is currently above the 60 level.
Key Support Levels – $490 and $480.
Key Resistance Levels – $500 and $505.

Related Articles

Coinbase secures MiCA licence in Luxembourg
Coinbase has announced a new regulatory milestone, revealing that the cryptocurrency exchange...

Here’s why the Kaia price has gone parabolic
Kaia price continued its strong rally on Friday, June 20, reaching its...

High risk, high reward: Crypto perpetual futures gain momentum in US
Coinbase is gearing up to launch crypto perpetual futures as the CFTC...

Ethereum Prepares For A Decisive Move: ETH/BTC Setup Could Trigger Altseason
Ethereum is approaching a critical test as price action tightens, setting the...
Leave a comment