- Home
- Advertise With us
- World News
- Tech
- Entertainment
- Travels & Tours
- Contact US
- About us
- Privacy Policy
Top Insights
Bitcoin Price Struggles to Reclaim Resistance — Sideways Action Dominates

Bitcoin price started a fresh decline below the $106,200 zone. BTC is now consolidating and facing resistance near the $105,500 zone.
- Bitcoin started a fresh decline below the $106,000 zone.
- The price is trading below $106,000 and the 100 hourly Simple moving average.
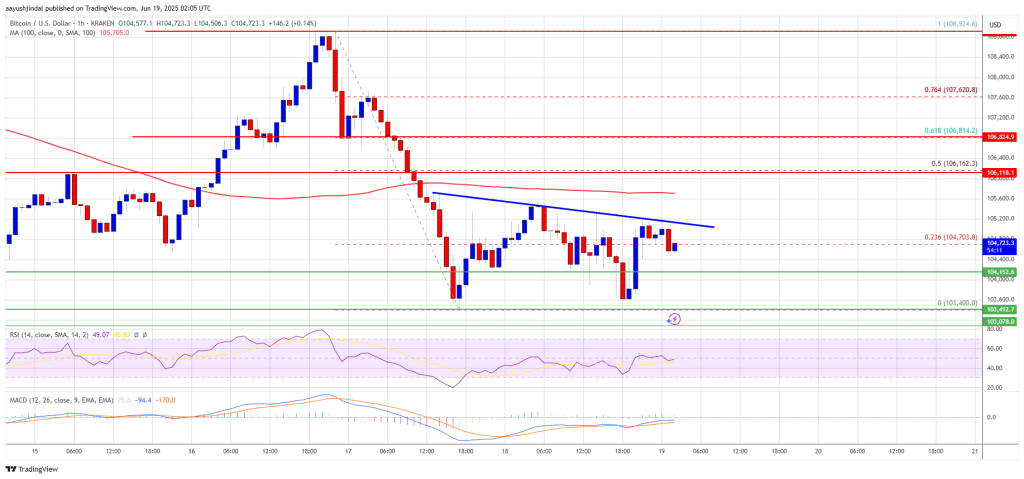
- There is a key bearish trend line forming with resistance at $105,200 on the hourly chart of the BTC/USD pair (data feed from Kraken).
- The pair could start a fresh increase if it stays above the $103,500 zone.
Bitcoin Price Starts Consolidation
Bitcoin price started a fresh decline below the $108,000 zone. BTC gained pace and dipped below the $107,000 and $106,000 levels.
There was a clear move below the $105,500 support level. Finally, the price tested the $103,500 zone. A low was formed at $103,400 and the price started a minor recovery wave. There was a move above the 23.6% Fib retracement level of the downward move from the $108,924 swing high to the $103,400 low.
However, the bears were active below the $105,500 zone. Bitcoin is now trading below $105,500 and the 100 hourly Simple moving average. There is also a key bearish trend line forming with resistance at $105,200 on the hourly chart of the BTC/USD pair.
On the upside, immediate resistance is near the $105,200 level. The first key resistance is near the $105,500 level. The next key resistance could be $106,150. It is near the 50% Fib retracement level of the downward move from the $108,924 swing high to the $103,400 low.
A close above the $106,150 resistance might send the price further higher. In the stated case, the price could rise and test the $108,800 resistance level. Any more gains might send the price toward the $110,000 level.
Another Decline In BTC?
If Bitcoin fails to rise above the $105,500 resistance zone, it could start another decline. Immediate support is near the $104,200 level. The first major support is near the $103,500 level.
The next support is now near the $102,650 zone. Any more losses might send the price toward the $101,200 support in the near term. The main support sits at $100,000, below which BTC might gain bearish momentum.
Technical indicators:
Hourly MACD – The MACD is now losing pace in the bearish zone.
Hourly RSI (Relative Strength Index) – The RSI for BTC/USD is now near the 50 level.
Major Support Levels – $104,200, followed by $103,500.
Major Resistance Levels – $105,500 and $106,200.
Related Articles
Bitcoin’s Momentum Wobbles—Analyst Predicts Correction Below $94K
Bitcoin’s recent climb to $105,000 has done little to shake off the...
Russia says 70% of crypto miners remain unregistered despite new laws
Russia will continue taking measures to encourage crypto mining businesses to register...
These Altcoins Are on Fire Backed by South Korea’s Crypto Giants
TL;DR Three low-cap altcoins experienced significant rallies after being embraced by Upbit...
Binance co-founder calls for crypto platforms to implement ‘will function’ for asset inheritance
Implementing a ‘will function’ in crypto platforms could ensure secure asset transfer,...


Leave a comment