- Home
- Advertise With us
- World News
- Tech
- Entertainment
- Travels & Tours
- Contact US
- About us
- Privacy Policy
Top Insights
Solana (SOL) Tests Support After Dip — Bounce or Breakdown Ahead?

Solana started a fresh decline from the $160 zone. SOL price is now consolidating losses and might decline further below the $145 level.
- SOL price started a fresh decline from the $160 resistance zone against the US Dollar.
- The price is now trading below $155 and the 100-hourly simple moving average.
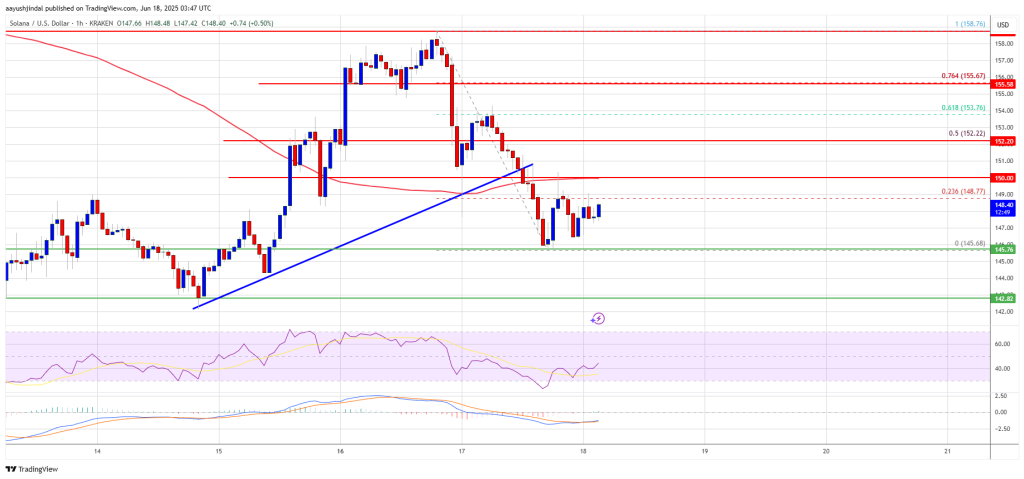
- There was a break below a bullish trend line with support at $150 on the hourly chart of the SOL/USD pair (data source from Kraken).
- The pair could start a fresh increase if it clears the $152 resistance zone.
Solana Price Dips Further
Solana price failed to continue higher above the $160 level and started a fresh decline, like Bitcoin and Ethereum. SOL gained pace and traded below the $155 support level.
There was a break below a bullish trend line with support at $150 on the hourly chart of the SOL/USD pair. The pair even traded below the $148 level. A low was formed near $145 and the price recently started a consolidation phase. It tested the 23.6% Fib retracement level of the recent decline from the $158 swing high to the $145 low.
Solana is now trading below $150 and the 100-hourly simple moving average. On the upside, the price is facing resistance near the $150 level. The next major resistance is near the $152 level. It is close to the 50% Fib retracement level of the recent decline from the $158 swing high to the $145 low.
The main resistance could be $155. A successful close above the $155 resistance zone could set the pace for another steady increase. The next key resistance is $160. Any more gains might send the price toward the $165 level.
Another Decline in SOL?
If SOL fails to rise above the $152 resistance, it could start another decline. Initial support on the downside is near the $145 zone. The first major support is near the $142 level.
A break below the $142 level might send the price toward the $130 zone. If there is a close below the $130 support, the price could decline toward the $125 support in the near term.
Technical Indicators
Hourly MACD – The MACD for SOL/USD is gaining pace in the bearish zone.
Hourly Hours RSI (Relative Strength Index) – The RSI for SOL/USD is below the 50 level.
Major Support Levels – $145 and $142.
Major Resistance Levels – $152 and $155.
Related Articles
Bitcoin Price Analysis: BTC Consolidation Continues but Bearish Signs Flash
After multiple failed attempts to break above the $108K resistance, Bitcoin is...
Norwegian crypto firm K33 raising more funds to buy up to 1,000 BTC
Norwegian crypto broker K33 is raising at least 85 million Swedish krona...
Researchers Forecast Bitcoin At $4.3 Million By 2036, Citing Institutional Demand
In a striking forecast, two academic researchers, Murray Rudd and Dennis Porter,...
Bitcoin price could fall under $100k, options data suggests
Bitcoin price has retreated in the past few days, and the futures...


Leave a comment